As Cisco explodes to new heights, is it 1999 all over again?
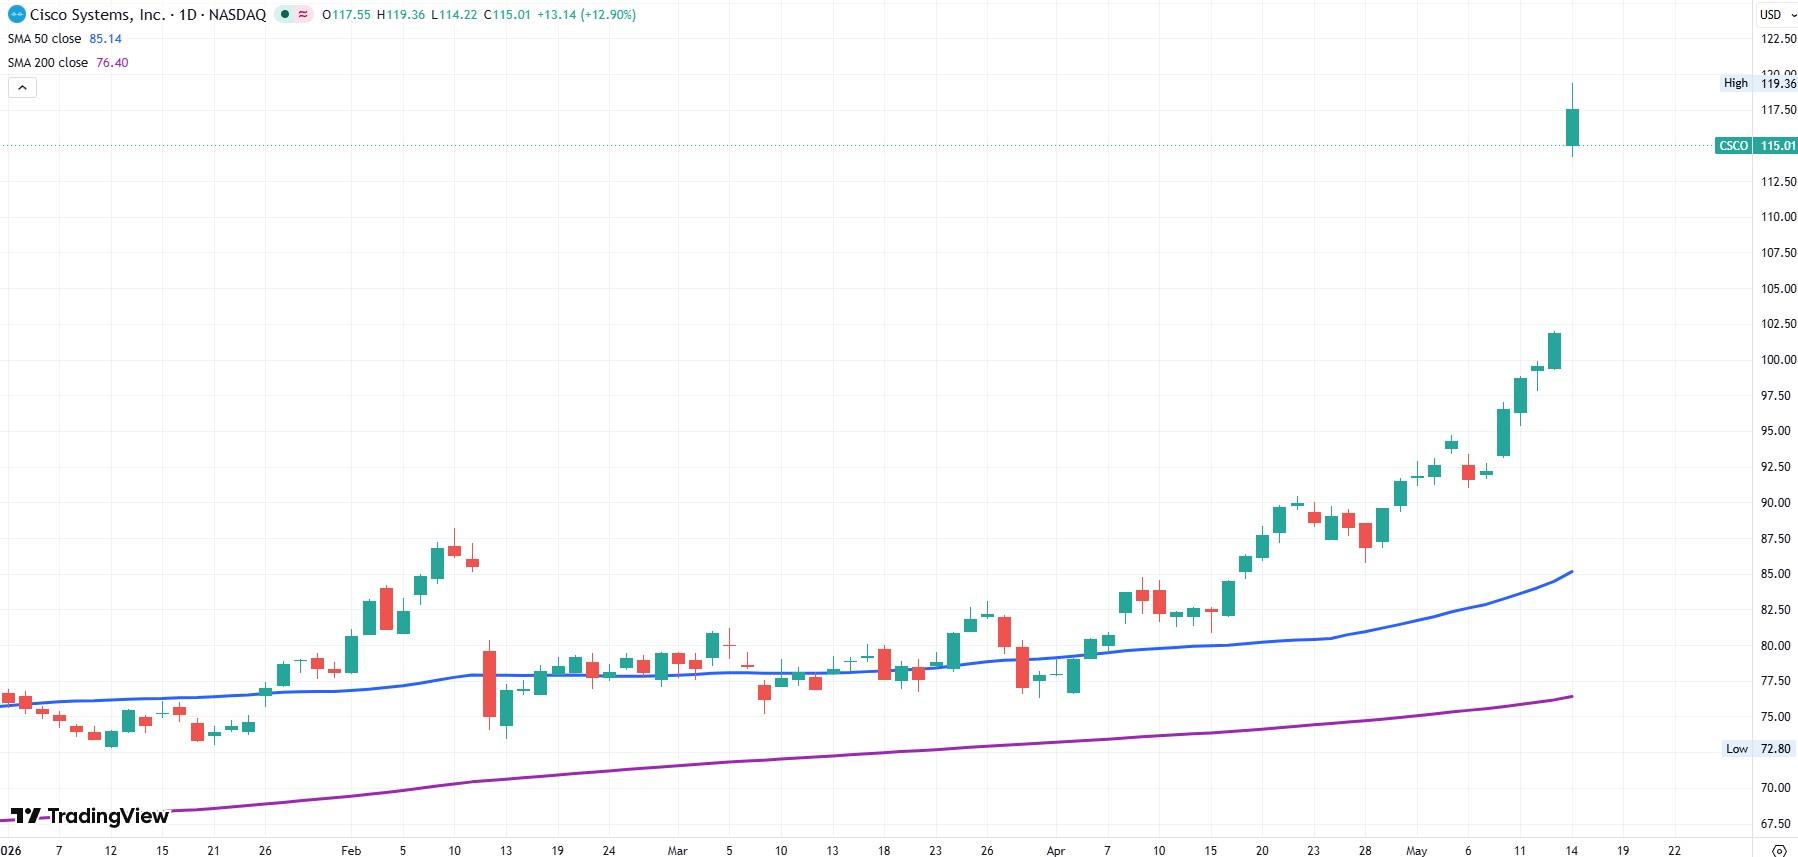
- Cisco Systems stock soared 15% after raising fiscal Q4 guidance.
- The hardware supplier is seeing plenty of demand from AI hyperscalers.
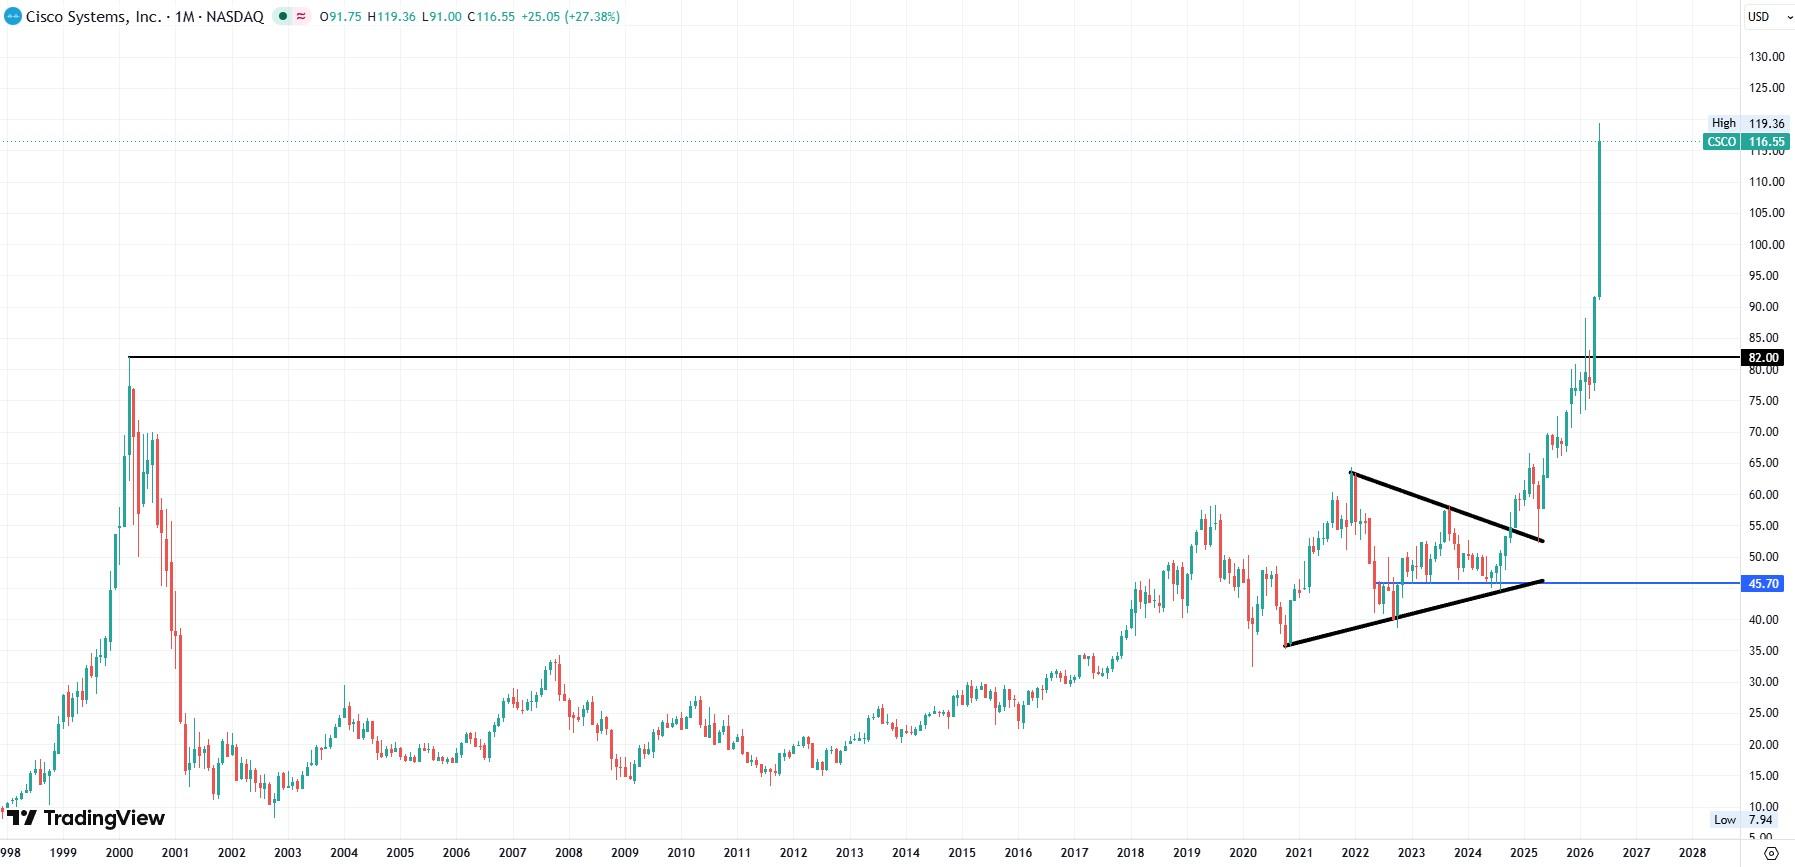
- CSCO stock closed above its March 2000 high on a monthly basis for the first time in April.
- Management raised Q4 revenue guidance by $1 billion.

Cisco Systems (CSCO) stock spikes more than 15% on Thursday in yet another sign that the US tech sector is experiencing euphoria not seen since 1999. The present setup for Thursday's rally stems from the company's fiscal third-quarter earnings call, in which management said they were seeing a major pickup in demand from AI hyperscalers.
"Given the strong demand, we now expect to take AI infrastructure orders of approximately $9 billion from hyperscalers in FY '26," said CEO Charles Robbins.
Cisco projected Q4 revenue of $16.8 billion, $1 billion above consensus, and adjusted earnings per share (EPS) of $1.17 or 10 cents above consensus.
Remembering 1999
In 1999, Cisco led the internet rally by gaining more than 126%, even outperforming the NASDAQ 100's spectacular 102% run.
After Cisco's spectacular bust beginning in March 2000, its 90% crash over the next 18 months would lead the US stock market down with it. Cisco failed to close on a monthly basis above that March 2000 high of $82 until last month.
Cisco joins Intel (INTC), another veteran of the NASDAQ DotCom rally that has recently seen its fortunes turn around for the better. After US President Donald Trump invested $10 billion of federal money in Intel in 2025, the stock has taken off. Gaining on growing demand for compute among the data center developers, Intel stock is up 438% in the last year.
Cisco might be the last of the legacy information technology to join the AI rally, which has been going on for nearly three years at this point, but it is nonetheless trading up over 90% in the last year.
Cisco daily stock chart
Cisco might look pricey to the value investors that tend to hold it, but it's still quite cheap based on forward earnings. The 2027 consensus for adjusted EPS is $4.68, which puts the present share price at about a 25x multiple, making it hard to argue that it's overvalued. Of course, the recent earnings news means that analysts stand to raise their earnings projection over the course of this year, so it might start to look much cheaper.
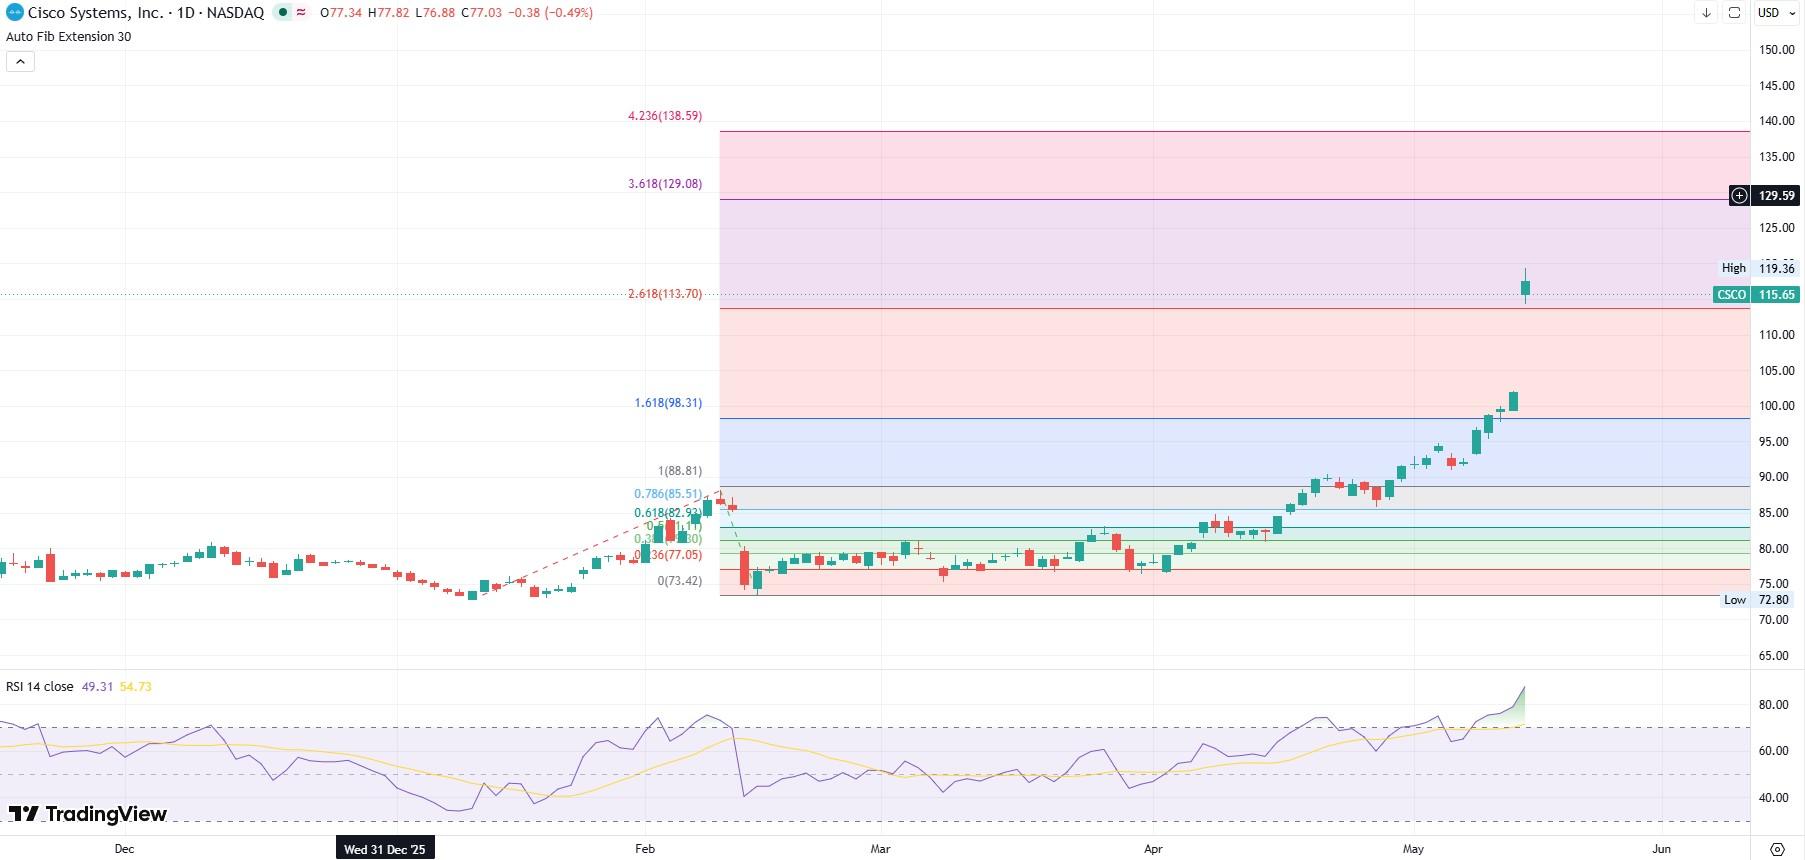
The Fibonacci Extension on the daily chart above shows us that CSCO has conquered the 261.8% Fibo. The next target on the chart is the 361.8% level at $129.08, followed by the 423.6% Fibo at $138.59.
In a retracement scenario, CSCO might find some support at the 261.8% Extension at $113.70.
Author

Clay Webster
FXStreet
Clay Webster grew up in the US outside Buffalo, New York and Lancaster, Pennsylvania. He began investing after college following the 2008 financial crisis.
















