|

Apple Inc. (AAPL) Elliott Wave technical analysis [Video]

AAPL Elliott Wave technical analysis

Function: Counter Trend.

Mode: Corrective.

Structure: Flat.

Position: Wave {ii} of C.

Direction: Expected downside in wave {iii}.

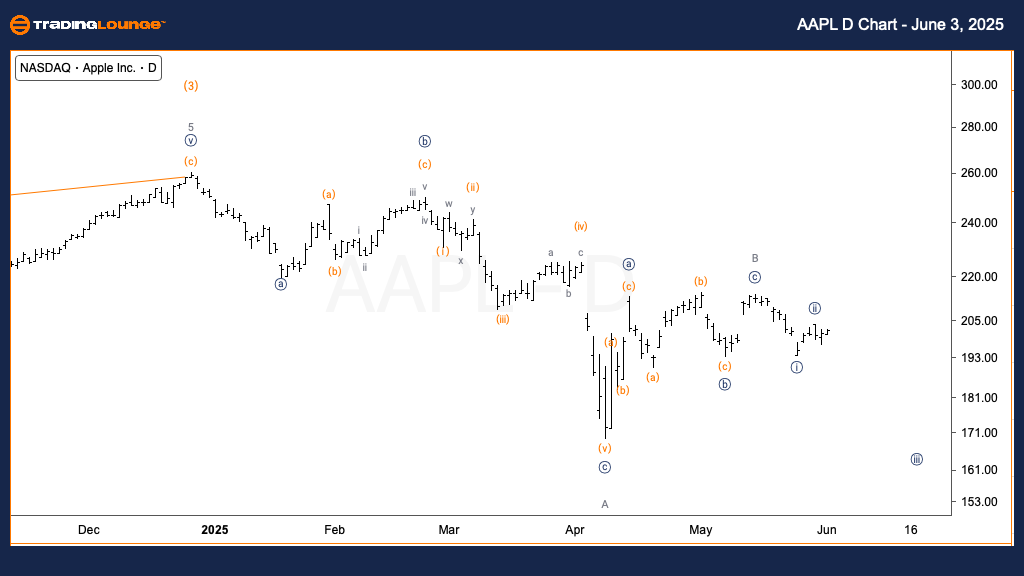
Details: Monitoring price resistance above $200 to validate the start of Minor wave C, which aims to complete Intermediate wave (4)

The daily chart analysis for Apple Inc. (AAPL) shows the stock in a corrective flat pattern. It currently sits within Minor wave C, anticipated to finalize a broader Intermediate wave (4). Confirmation of the bearish wave count hinges on price rejection at the $200 level. If AAPL fails to break above this key resistance, it would support a downside move into wave {iii} of C.

Apple Inc. (AAPL) daily chart

Chart

AAPL Elliott Wave technical analysis

Function: Counter Trend.

Mode: Corrective.

Structure: Flat.

Position: Wave {c} of B.

Direction: Expected upside in wave {c}.

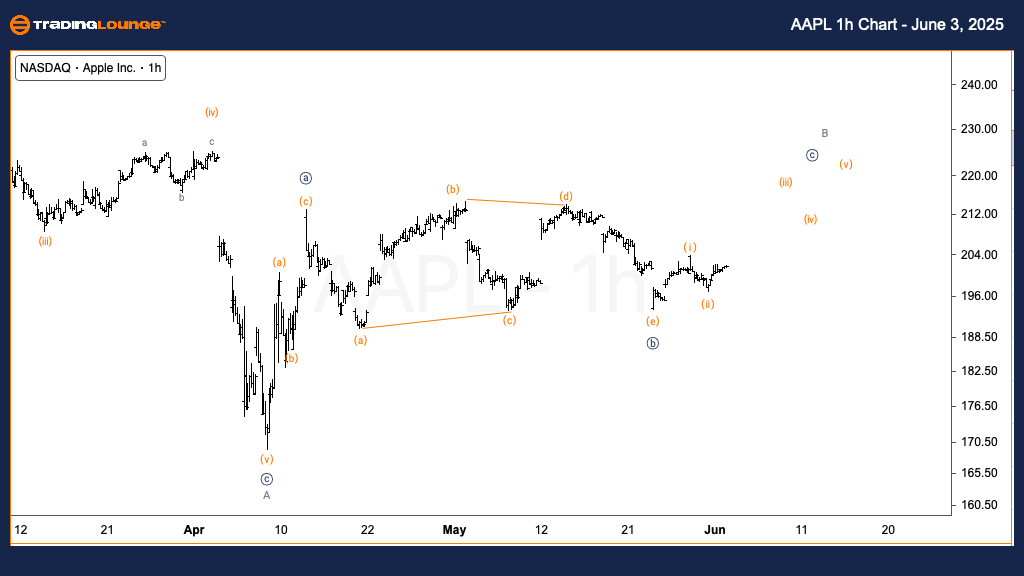
Details: A triangle pattern in Minute wave {b} near TradingLevel2 ($200) suggests consolidation and a short-term breakout to the upside to complete wave B.

On the 1-hour chart, AAPL appears poised for a near-term rise as it forms wave {c} of B. The recent triangle observed in Minute wave {b} around the $200 TradingLevel2 zone reflects market indecision, likely preceding an upward breakout. This move would complete wave B before a probable decline resumes in wave C.

Apple Inc. (AAPL) one-hour chart

Apple Inc. (AAPL) Elliott Wave technical analysis [Video]

Author

Peter Mathers

Peter Mathers

TradingLounge

Peter Mathers started actively trading in 1982. He began his career at Hoei and Shoin, a Japanese futures trading company.

More from Peter Mathers
Share:

Markets move fast. We move first.

Orange Juice Newsletter brings you expert driven insights - not headlines. Every day on your inbox.

By subscribing you agree to our Terms and conditions.

Editor's Picks

EUR/USD recovers to 1.1750 region as 2025 draws to a close

Following the bearish action seen in the European session on Wednesday, EUR/USD regains its traction and recovery to the 1.1750 region. Nevertheless, the pair's volatility remains low as trading conditions thin out on the last day of the year.

GBP/USD stays weak near 1.3450 on modest USD recovery

GBP/USD remains under modest beairsh pressure and fluctuates at around 1.3450 on Wednesday. The US Dollar finds fresh demand due to the end-of-the-year position adjustments, weighing on the pair amid the pre-New Year trading lull. 

Gold retreats to $4,300 area, looks to post monthly gains

Gold stays on the back foot on the last day of 2025 and trades near $4,300, possibly pressured by profit-taking and position adjustments. Nevertheless, XAU/USD remains on track to post gains for December and extend its winning streak into a fifth consecutive month.

Bitcoin, Ethereum and XRP prepare for a potential New Year rebound

Bitcoin, Ethereum, and Ripple are holding steady on Wednesday after recording minor gains on the previous day. Technically, Bitcoin could extend gains within a triangle pattern while Ethereum and Ripple face critical overhead resistance. 

Economic outlook 2026-2027 in advanced countries: Solidity test

After a year marked by global economic resilience and ending on a note of optimism, 2026 looks promising and could be a year of solid economic performance. In our baseline scenario, we expect most of the supportive factors at work in 2025 to continue to play a role in 2026.

Crypto market outlook for 2026

Year 2025 was volatile, as crypto often is.  Among positive catalysts were favourable regulatory changes in the U.S., rise of Digital Asset Treasuries (DAT), adoption of AI and tokenization of Real-World-Assets (RWA).