AMD: Surges over 38 percent from the blue box after earnings report

In today’s article we’ll be focusing on $AMD. The stock has surged over 38% from the projected Blue Box area ahead of its earnings report. We’ll examine how the technical structure aligns with the fundamentals, highlighting the relationship between market structure and Fundamentals in this case the Earning Report that was release on 05.05.2026
Who is AMD?
AMD (Advanced Micro Devices, Inc.) is a leading American semiconductor company headquartered in Santa Clara, California, best known for designing CPUs, GPUs, and high‑performance computing solutions. It is a major rival to Intel and NVIDIA, with products powering PCs, servers, gaming consoles, and AI data centers, with a Market cap at $579 Billion as of May 2026.
AMD pullback reaches the blue box area
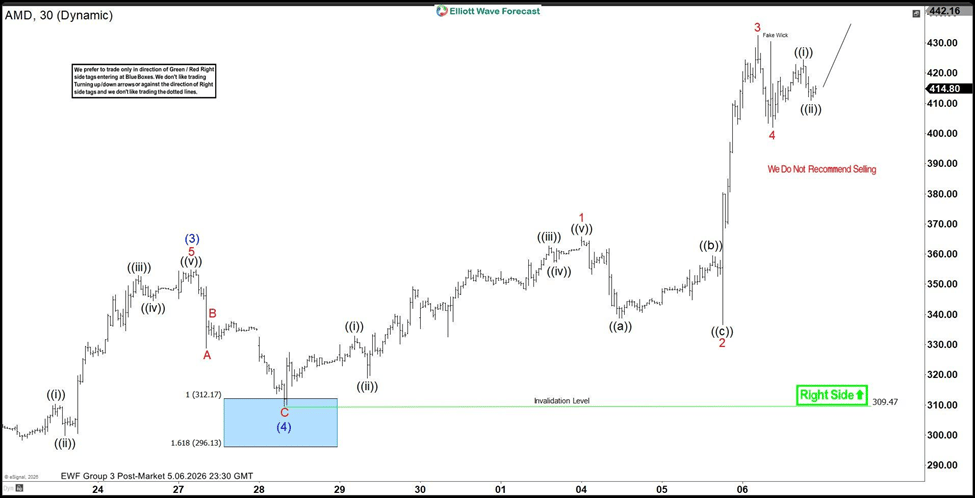
AMD has delivered another textbook Elliott Wave reaction after completing a strong impulsive rally into the late-April highs. In our latest forecast, we warned members not to chase the upside and instead expected a corrective pullback toward the Blue Box area before buyers re-emerged.
The forecast: Identifying the corrective pullback
On April 28, 2026, our analysis identified that AMD had completed a clean five-wave impulsive move to the upside, peaking at Red Wave 5. Following the basic principles of Elliott Wave, an impulsive move is always followed by a three-wave corrective sequence.
We labelled the subsequent move lower as an ABC zigzag correction. Based on Fibonacci extension and retracement levels, we projected a “Blue Box” area between 312.17 (100% extension) and 296.13 (161.8% extension). This zone represented a high-frequency area where Wave C was likely to terminate, and the primary bullish trend would resume.
Why the blue box matters?
At EWF, the Blue Box is one of our highest probability trading areas. It identifies regions where the market is statistically likely to complete a correction and resume the dominant trend.
In AMD’s case:
- The larger trend remained bullish
- The right side continued pointing higher
- The decline was expected to remain corrective rather than impulsive
The execution: Entering the blue box
As the above chart illustrates, we remained patient as AMD traded lower toward our target. The key was the “Right Side” tag, which remained green, indicating that the larger-degree trend was still bullish. Our strategy was clear: we do not recommend selling, but rather waiting for the correction to find its floor within the identified support zone.
On April 29, price action entered the top of the Blue Box, bottoming out perfectly around the 309.47 level. This move completed Wave (4) and set the stage for the next impulsive cycle as seen below.
The result: A massive impulsive rally
The above chart from May 6, 2026, shows the remarkable accuracy of this technical setup. Once the (4) wave terminated in the Blue Box, buyers took complete control and ignited a massive, multi‑wave impulsive rally that cleared previous high level in its path. AMD broke out of the zone with a clean five‑wave sequence at a smaller degree, confirming that the trend had officially shifted upward. The rally reached its most aggressive phase during the mid‑cycle Wave 3, where vertical price expansion unfolded, and momentum entered the profit taking zone. After a brief volatility event near the $430 level the stock completed Wave 3 and is now consolidating in what appears to be a Wave ((ii)) pullback.
Conclusion
The results speak for themselves: AMD entered around the $312 Blue Box support and quickly surged past $430, delivering over 38% gains in roughly a week of trading. Staying on the Right Side remains the guiding principle, and as the chart clearly states, selling is not recommended. Current price action suggests AMD is simply pausing before the next leg higher, and with the Right Side still pointing up, every corrective dip continues to present opportunity for traders following the sequence.
This brings us to the conclusion that fundamentals often serve as the final piece in completing the structure. As the correction unfolded into the Blue Box area just days before AMD’s earnings release, the technical setup was already in place. When the earnings report came out, it perfectly complemented the forecast, fuelling the surge to the upside and validating the alignment between structure and fundamentals.
At Elliottwave Forecast (EWF), we deliver consistent market updates through regular charts update. Our analysts update 1‑hour charts four times daily and 4‑hour charts once per day across all 78 instruments. In addition, we host five live sessions each day and maintain a 24‑hour chatroom, providing clients with real‑time market guidance and answers to any questions they may have.
Author

Elliott Wave Forecast Team
ElliottWave-Forecast.com
















