AMCOR PLC – AMC Elliott Wave technical forecast [Video]
![AMCOR PLC – AMC Elliott Wave technical forecast [Video]](https://editorial.fxsstatic.com/images/i/General-Stocks_1.png)
AMCOR PLC – AMC Elliott Wave technical analysis
Today’s Elliott Wave analysis from TradingLounge focuses on AMCOR PLC (ASX:AMC). We identify significant upward potential in the AMC stock. The chart suggests the beginning of a third wave. In this breakdown, we detail the projected price targets and the invalidation level that defines the validity of this wave forecast.
AMCOR PLC – AMC one-day chart (semilog scale) analysis
-
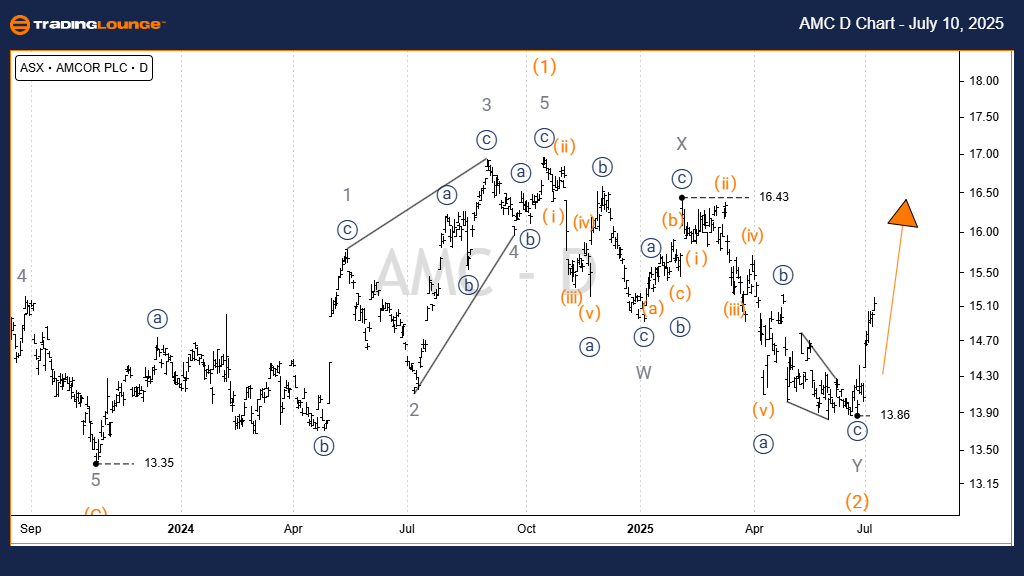
Function: Major trend (Intermediate degree, Orange).
-
Mode: Motive.
-
Structure: Impulse.
-
Position: Wave 3) - orange.
Details:
Wave 3) - orange may now be progressing upward. From the 13.35 low, wave 3)) - navy is advancing and appears extended. It breaks down further into wave 1),2) - orange, which seems to have concluded. Following the 13.82 low, wave 3) - orange is moving higher, aiming at a target between 17.56 and 20.37.
Price must hold above 13.82 to support the continuation toward 5)) - navy.
Invalidation point: 13.86
AMCOR PLC – AMC Four-hour chart analysis
-
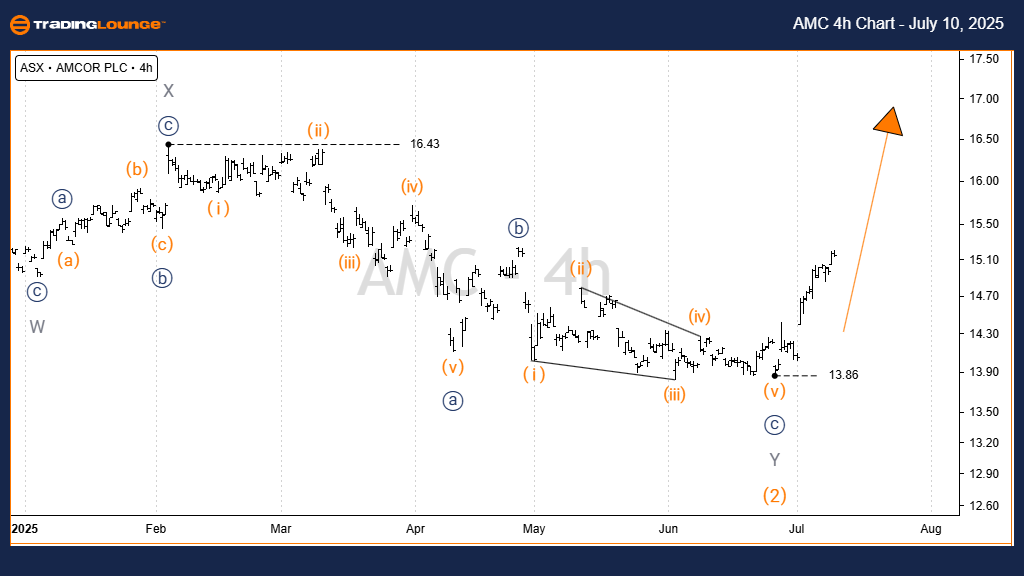
Function: Major trend (Intermediate degree, orange).
-
Mode: Motive.
-
Structure: Impulse.
-
Position: Wave 3) - orange.
Details:
The wave structure continues upward. The stock is approaching the previous high at 16.43 and likely to pursue higher levels. To maintain this outlook, the price must stay above 13.86.
Invalidation point: 13.86
Conclusion
This technical forecast on AMCOR PLC (AMC) offers insights into both the broader market direction and short-term movements. Specific validation and invalidation price levels support the confidence in this Elliott Wave count. Through precise wave tracking and disciplined analysis, we aim to provide a professional and objective perspective for informed trading.
AMC Elliott Wave technical forecast [Video]
Author

Peter Mathers
TradingLounge
Peter Mathers started actively trading in 1982. He began his career at Hoei and Shoin, a Japanese futures trading company.


