|

Alibaba Group. ($BABA) extreme area offering a buying opportunity

In today’s article, we’ll review the recent performance of Alibaba Group. ($BABA) through the lens of Elliott Wave Theory.  We’ll review how the rally from the Jan 8th 2026 low unfolded as a 5-wave impulse followed by a 3-swing correction (ABC) and discuss what could come next. Let’s explore the structure and the expectations for this stock.

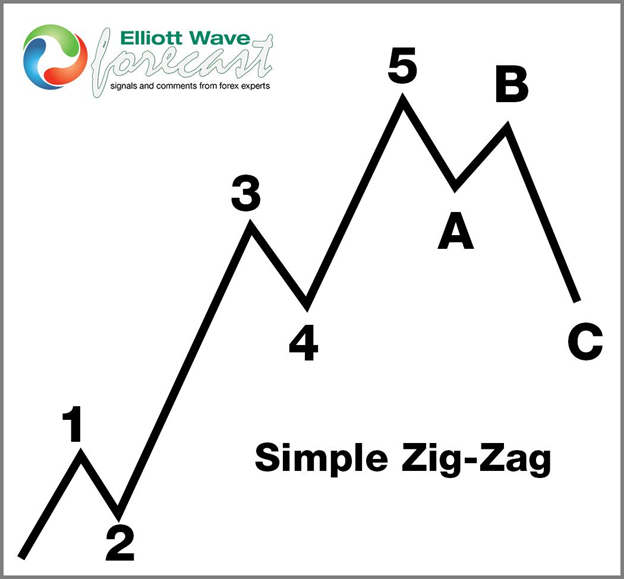
Five wave impulse structure + ABC correction

BABA

$BABA one-hour Elliott Wave chart 1.18.2026

Chart

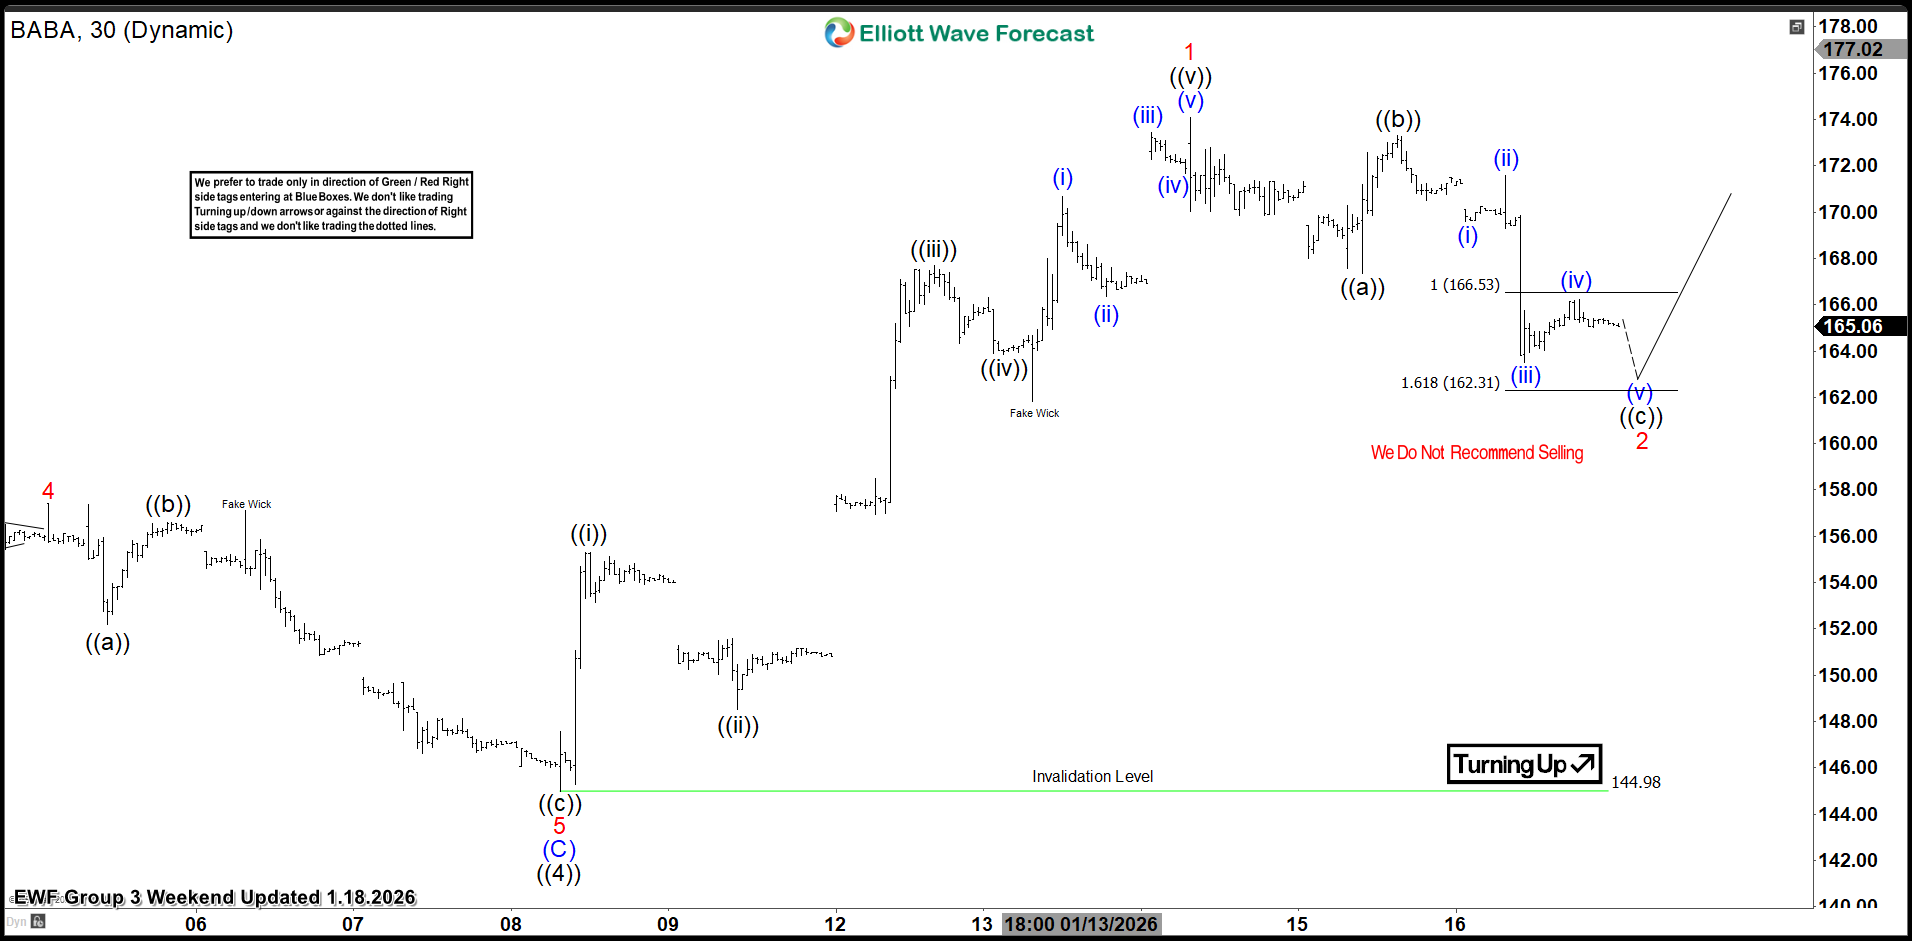
In the 1H chart from Jan 18, 2026, $BABA completed a clear 5-wave impulsive cycle labeled red 1. After such a move, a corrective pullback is typical. As expected, the stock began to retrace in three swings, forming what we identify as an ABC correction.

The price action suggested that buyers would likely appear near the extreme area between $166.53 and $162.31. This zone represents the ideal region where a correction usually ends and a new bullish cycle begins.

In other words, the market took a brief pause before potentially resuming its primary uptrend. Therefore, this structure aligns well with a standard Elliott Wave correction, offering traders a technical roadmap.

$BABA one-hour Elliott Wave chart 1.22.2026

BABA

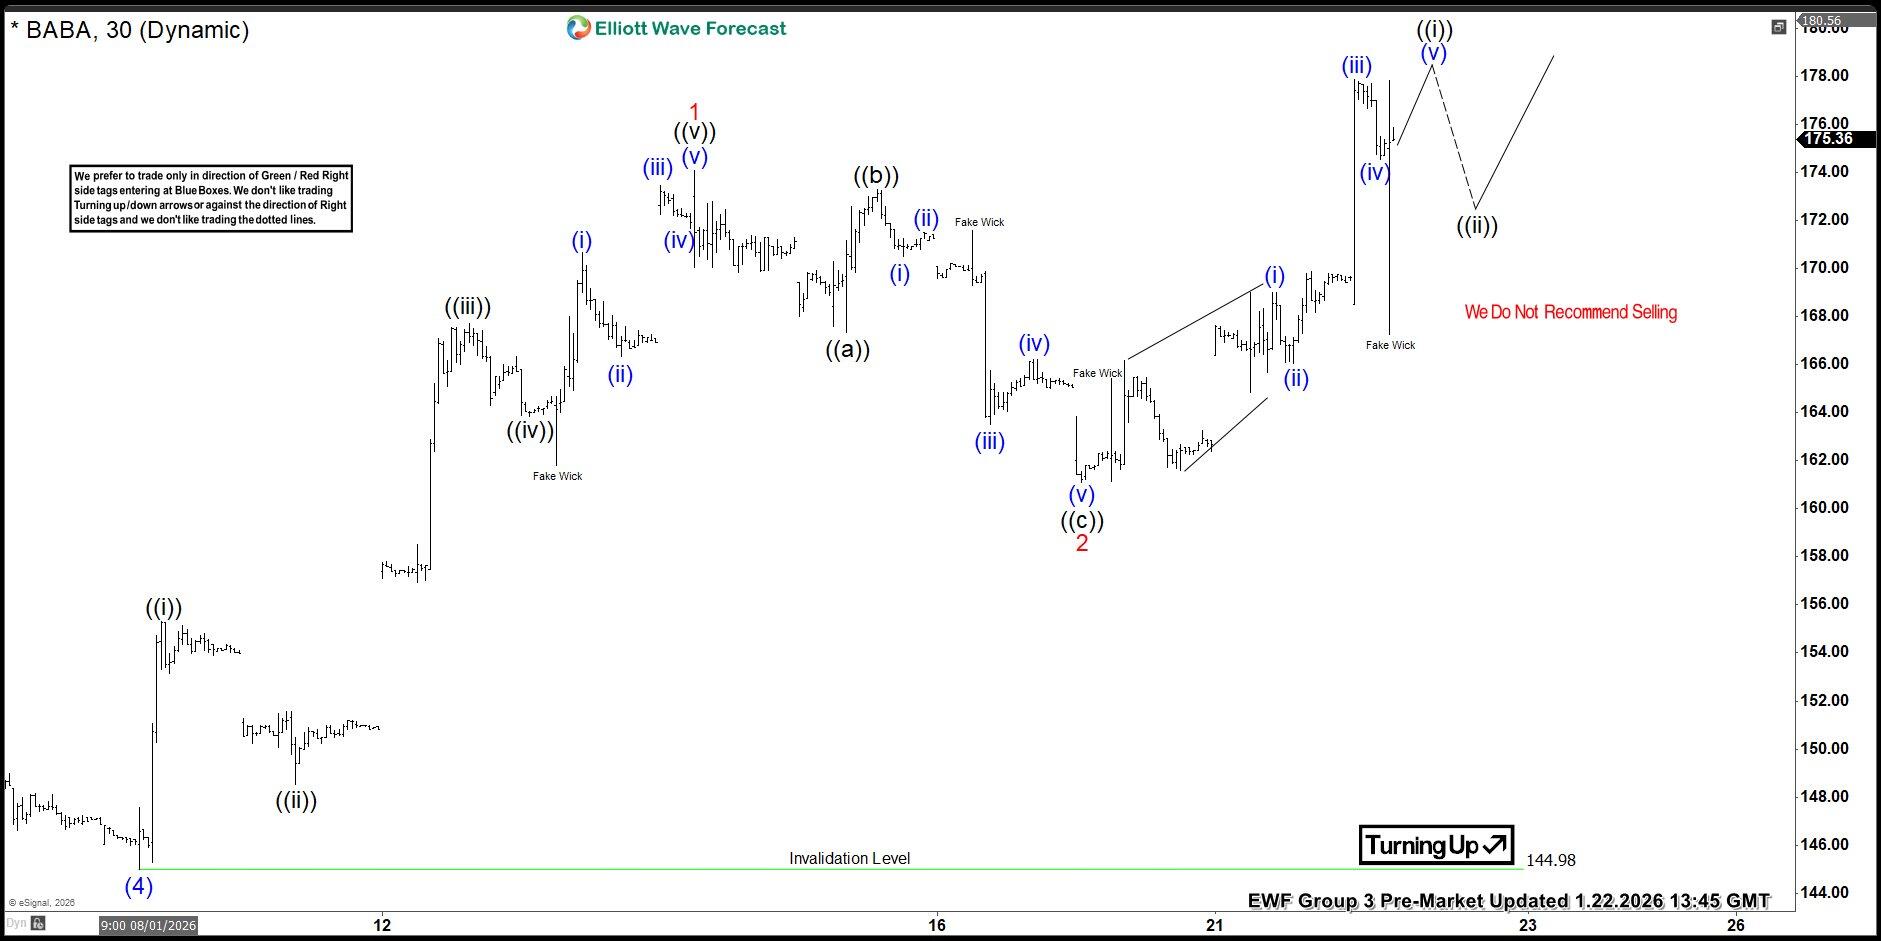
Few days later, the stock bounced and made new highs confirming the bullish trend. Currently, it is looking to remain supported against 1/20 low and higher in wave 3 of (3). Longs should be risk free and looking for $190-207 area as the next possible target.

Conclusion

In conclusion, our Elliott Wave analysis of $BABA suggests the stock continues to trade within a bullish framework. By using Elliott Wave Theory, traders can better anticipate market structure, identify continuation zones, and plan trades with greater confidence.

In addition, understanding how impulse and correction phases interact helps improve risk control, especially in volatile markets like this one. Therefore, maintaining flexibility and discipline remains key as this structure evolves.

Author

Elliott Wave Forecast Team

Elliott Wave Forecast Team

ElliottWave-Forecast.com

More from Elliott Wave Forecast Team
Share:

Editor's Picks

GBP/USD appears well offered near 1.3160

GBP/USD builds on Tuesday’s losses, although it now manages to pick up some pace and bounce off earlier multi-month troughs near 1.3140. The Greenback’s solid performance and continued political turmoil in the UK are keeping Cable under persistent pressure, with little sign of a meaningful recovery.

EUR/USD softens to near 1.1350 as Fed hike bets rise ahead of PCE inflation data

The EUR/USD pair declines to around 1.1355 during the early Asian trading hours on Thursday. The Euro weakens to its lowest level since June 2025 against the US Dollar as traders increase their bets on US interest rate hikes later this year. The US May Personal Consumption Expenditures inflation data will be the highlight on Thursday. 

Gold off YTD lows, still struggles around $4,000 on hawkish Fed bets

Gold is off year-to-date lows, still struggling around $4,000 in the Asian session on Thursday as bears pause following the overnight slump to the lowest level since November 2025. Despite easing inflationary concerns amid falling oil prices, elevated Fed rate-hike bets help the US Dollar preserve its recent strong gains to the highest level since May 2025, weighing on non-yielding bullion.

Crypto market sheds over 50% of its value amid Bitcoin's brief decline below $60K
The crypto market has erased more than half of its value since reaching an all-time high in late 2025. The decline underscores the severity of the recent bear market and lack of a fresh catalyst to revive investor interest, according to a Wednesday X post by The Kobeissi Letter. The total crypto market cap peaked at a record $4.3 trillion on October 6, 2025.
5.90% to 5.45%: Why the Pound ignored the bond market’s relief rally
Keir Starmer resigned on Monday, and the Pound barely moved. That near-silence is the tell. Sterling's real driver these past four months has not been the prime minister, nor the left-leaning frontrunner lining up to replace him, but the long end of the gilt curve, which answers to a force no British politician controls.
Regime change: Inside Kevin Warsh's first move to make the Fed unreadable on purpose

The rate did not move. That was the least interesting thing about Kevin Warsh's first meeting in charge of the Fed. The FOMC held its benchmark at 3.50%-3.75% for the fourth straight meeting, exactly as priced, and then the new chair used his first press conference to dismantle the machinery the market has leaned on for a decade.