Dow Jones Industrial Average fades a soft-inflation bounce as yields climb
- DJIA closes on its low, just under 51,000, as the 10-year yield nears 5.30%.
- A 4.3% September loss against 0.5% for the S&P 500.
- Nonfarm Payrolls due Friday, forecast at 90K after 162K.

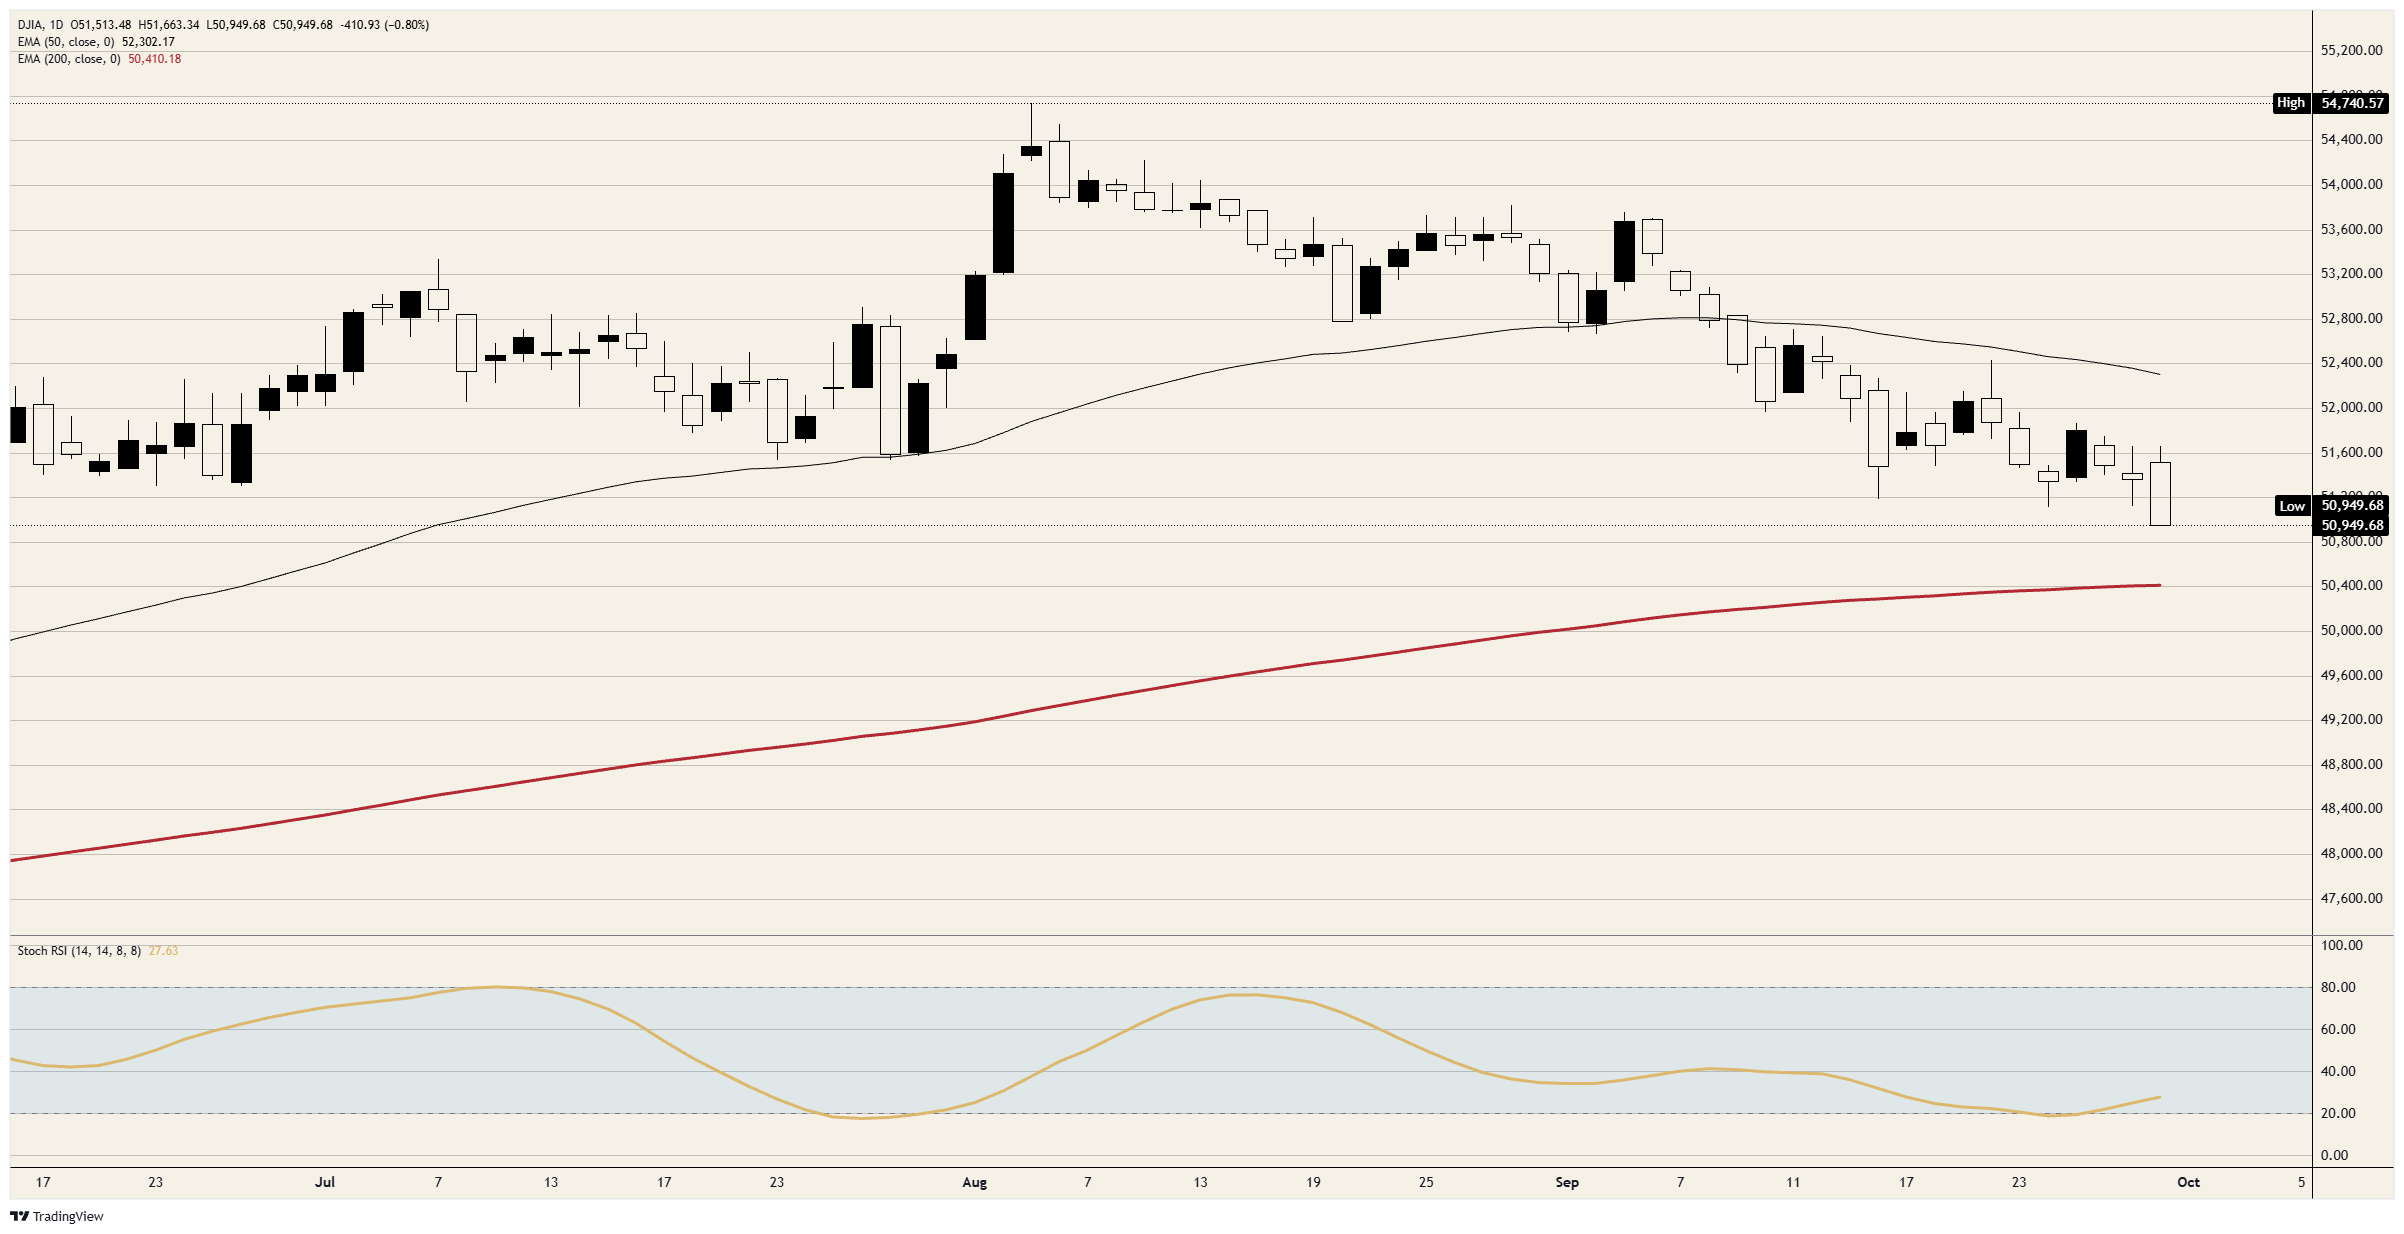
The 10-year Treasury yield rose to near 5.30% on Wednesday, its highest since 2007, on the same day US inflation came in under forecast. The Dow Jones Industrial Average rallied on the inflation release, faded for the rest of the session and closed on its low, just under 51,000. That's the index's lowest close in more than three months.
September cost the Dow 4.3%, against a 0.5% dip for the S&P 500, and the index lost 2.7% over the third quarter while the S&P 500 and the Nasdaq Composite both gained. The Dow holds far fewer of the technology names that rallied on the lower odds of an October Fed hike. It was the same economy and the same Fed, and the Dow lost more than eight times as much as the broader index in September.
Bonds fell on the inflation number that should have lifted them
Core Personal Consumption Expenditures (PCE) prices, the Fed's preferred inflation measure, rose 0.2% in August against a 0.3% forecast, and the annual rate held at 3% against a 3.3% forecast. Futures cut the chance of an October Fed hike to about 35% from about 51% on Tuesday, according to CME's FedWatch tool, though a December hike is still expected.
The rest of Wednesday's data ran hot. The private payroll count from Automatic Data Processing (ADP) came in at 90K against a 70K forecast, and the Chicago Purchasing Managers Index (PMI) jumped to 58.8 from 47.1. Traders sold Treasuries on the strength, and a higher 10-year yield feeds into the mortgage, car and business loan rates that the Dow's industrial and consumer names depend on. The 10-year finished higher on a day US inflation came in lower, which is the reverse of how a soft inflation number is supposed to work.
The October odds get repriced on Friday's jobs count
The Institute for Supply Management (ISM) manufacturing index is due Thursday at 14:00 GMT, forecast at 55 from 54.6, and five Fed officials are scheduled to speak the same day. Nonfarm Payrolls follow on Friday at 12:30 GMT, forecast at 90K after 162K, with unemployment forecast to hold at 4.1%. A strong count would push the October odds and the 10-year yield back up, and the yield is what the Dow traded all September.
Minneapolis Fed President Kashkari said after the close that inflation near 3% is still too high and that the new data didn't change that story. Read literally, the Fed's case for hiking survived a soft inflation number, and futures traders cut October's odds by about a third on the same number anyway.
Levels after the September floor gave way
Resistance: 51,100 is the September floor the index held on three tests before Wednesday's close beneath it. Wednesday's high, short of 51,700, is where the rally on the inflation release ran out.
Support: Wednesday's close on its low, just under 51,000, is the first mark. The 200-day Exponential Moving Average (EMA) near 50,400 comes next, and the index has closed above it every session since at least mid-June, with 50,000 beneath that.
Bias: Lean short while 51,100 caps on a closing basis, looking for 50,400 first and 50,000 second. Momentum on the daily Stochastic Relative Strength Index (Stoch RSI) reads near 28 and is turning up from the bottom, so a retest of 51,100 would fit the call rather than break it. A daily close above 51,700 ends the short.
Dow Jones daily chart
Dow Jones FAQs
The Dow Jones Industrial Average, one of the oldest stock market indices in the world, is compiled of the 30 most traded stocks in the US. The index is price-weighted rather than weighted by capitalization. It is calculated by summing the prices of the constituent stocks and dividing them by a factor, currently 0.152. The index was founded by Charles Dow, who also founded the Wall Street Journal. In later years it has been criticized for not being broadly representative enough because it only tracks 30 conglomerates, unlike broader indices such as the S&P 500.
Many different factors drive the Dow Jones Industrial Average (DJIA). The aggregate performance of the component companies revealed in quarterly company earnings reports is the main one. US and global macroeconomic data also contributes as it impacts on investor sentiment. The level of interest rates, set by the Federal Reserve (Fed), also influences the DJIA as it affects the cost of credit, on which many corporations are heavily reliant. Therefore, inflation can be a major driver as well as other metrics which impact the Fed decisions.
Dow Theory is a method for identifying the primary trend of the stock market developed by Charles Dow. A key step is to compare the direction of the Dow Jones Industrial Average (DJIA) and the Dow Jones Transportation Average (DJTA) and only follow trends where both are moving in the same direction. Volume is a confirmatory criteria. The theory uses elements of peak and trough analysis. Dow’s theory posits three trend phases: accumulation, when smart money starts buying or selling; public participation, when the wider public joins in; and distribution, when the smart money exits.
There are a number of ways to trade the DJIA. One is to use ETFs which allow investors to trade the DJIA as a single security, rather than having to buy shares in all 30 constituent companies. A leading example is the SPDR Dow Jones Industrial Average ETF (DIA). DJIA futures contracts enable traders to speculate on the future value of the index and Options provide the right, but not the obligation, to buy or sell the index at a predetermined price in the future. Mutual funds enable investors to buy a share of a diversified portfolio of DJIA stocks thus providing exposure to the overall index.
Author

Joshua Gibson
FXStreet
Joshua joins the FXStreet team as an Economics and Finance double major from Vancouver Island University with twelve years' experience as an independent trader focusing on technical analysis.