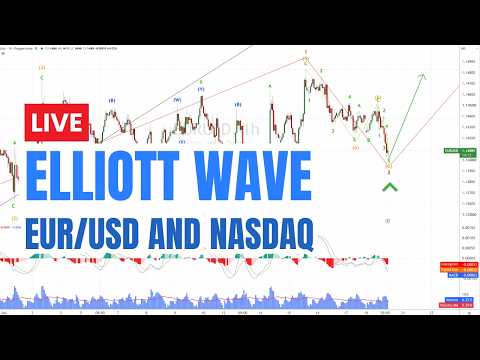
EUR/USD and Nasdaq: Finding the end of the waves with the MACD [Video]
![EUR/USD and Nasdaq: Finding the end of the waves with the MACD [Video]](https://editorial.fxsstatic.com/images/i/eur-usd-002.jpg)
Counting Elliott waves is where most beginners get frustrated and quit. Is this Wave 3 or Wave C? Did Wave 2 already end, or will it make one more low? Without an objective tool, counting waves turns into guessing — and guessing in the markets costs money. In this breakdown, I show you a simple technique that removes a lot of that uncertainty: using MACD crossovers to validate the end of each wave.
The problem with counting waves by eye
Elliott Wave theory is powerful, but it has an Achilles' heel for beginners: subjectivity. Two analysts can look at the same chart and count the waves differently. That ambiguity makes many traders distrust the method or apply it poorly.
The solution isn't to abandon Elliott Wave — it's to add a layer of objective confirmation. And that's where the MACD becomes the wave analyst's best ally.
The technique: Each clean cross marks the end of a wave
The principle is direct. When the MACD line crosses the signal line cleanly, and then stays without crossing throughout a move, that stretch without crosses corresponds to a complete wave.
On EUR/USD, the video shows this clearly. One cross marks the end of Wave 1. The next cross marks the end of Wave A. When the market goes sideways within Wave B, we see the internal crosses of the ABC that makes up that Wave B. And when the MACD crosses again, it signals we've entered the active Wave C.
Each wave transition has its signature in the MACD. It's not that the MACD predicts the waves — it's that it confirms when one ends and another begins, taking the guesswork out of the count.
Why a "clean" cross matters so much
Here's the nuance that separates this technique from a superficial use of the MACD.
A clean cross means the MACD crossed once and didn't cross again throughout the move. That behavior — a cross, then a long stretch with no crosses — is what marks a complete cycle of a wave. If the MACD crosses and uncrosses several times in a short stretch, we're not looking at a clean wave but at sideways noise, and that's where the count gets complicated.
On the Nasdaq, the video shows a beautiful example of this: a clean MACD cross to the downside, with no intermediate crosses, marking the entire descent from the end of Wave 2 to the end of Wave 3. That uninterrupted stretch is the signal that it was a single structural move, not several.
The critical distinction: Three-wave sequence vs. wave 3
There's an advanced point in the video worth highlighting because it's where money is made or lost in Elliott Wave.
When price makes three moves down, the question arises: is it a corrective three-wave sequence (ABC) about to end, or an impulsive Wave 3 that still has more to go? The difference is enormous for the trade decision, and distinguishing them in the live market is, in the video's own words, the difference between having success or not.
The MACD helps resolve this. If a clear divergence appears on the third move — price makes a new low but the MACD doesn't — that suggests exhaustion and favors the scenario that the cycle is ending. If the MACD keeps showing strength with no divergence, it favors continuation. The tool doesn't eliminate judgment, but it gives objective evidence to decide on.
Never guess the entry
The lesson running through the entire video is this: never guess the entry. Always look for an objective confirmation.
The MACD crossing the signal line is one of the simplest ways to get that confirmation. For someone starting out, it's an accessible and reliable trigger. As you gain experience, you'll incorporate tools that let you confirm faster and earlier. But the principle doesn't change: objective validation over gut feeling.
The core idea
The MACD doesn't replace Elliott Wave — it makes it usable. It turns a subjective method into one with objective confirmation points, marking the end of each wave with its signal line crosses. For anyone building their wave reading, it's the difference between guessing and validating.
This is the kind of analysis we apply every day in our trading room, across multiple markets and timeframes.
Author

Juan Maldonado
Elliott Wave Street
Juan Maldonado has a University degree in Finance, and Foreign trade started his trading career in 2008. Since 2010 has been analyzing the markets using Elliott Wave with different strategies to spot high probability trades.















