A complete Oil trade: Volume profile, liquidity and Elliott Wave [Video]
![A complete Oil trade: Volume profile, liquidity and Elliott Wave [Video]](https://editorial.fxsstatic.com/images/i/West-Texas-Intermediate_3.png)
A good trade isn't born from a hunch, but from the alignment of several objective signals. In this breakdown we work through a complete, step-by-step trade on oil futures, combining Volume Profile, institutional liquidity, and Elliott Wave. It's a real example we followed in our membership, and it ends with one of the most objective exit signals in the system: the liquidity cross.
The starting point: A wave 3 with strong momentum
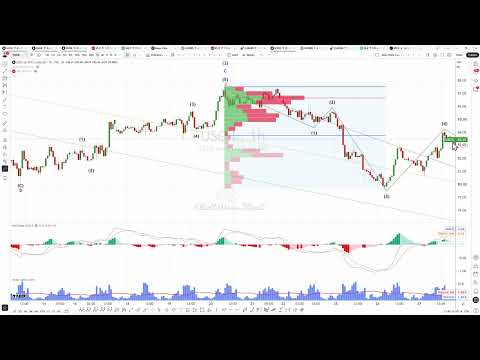
Oil had been in a bearish move — a Wave 3, typically the strongest-momentum leg in the Elliott sequence. The MACD confirmed that strength. But the question that matters isn't what happened, it's what the Market Maker is building next: will the drop continue, or is a bounce coming? And if it comes, how deep?
To answer that, we stack layers of analysis.
Layer 1: Volume profile and exhausting supply
The first tool is Volume Profile, available in TradingView. We apply it from the high to the low of the move and observe the volume distribution.
The distribution was unbalanced: most of the volume concentrated at the top, while at the bottom the volume was very low. That reading tells us something concrete — transactions are decreasing, supply is exhausting. When supply exhausts at the bottom of a bearish move, price tends to return toward the value area, which in this case sat around the 84 level. That balance zone becomes the minimum target of the retracement.
With this we already know where price might go. But we're missing the most important piece: whether the institutions agree.
Layer 2: the Big Guy's liquidity
Here the VolWaves model comes in. The black line represents price; the orange line represents the Big Guy's intention — in the oil market, the oil companies, which are the main institutions.
And here the key signal appears: while price was falling, the Big Guy line began rising. That is, while price dropped, the institutions were buying. They're in accumulation mode. That divergence between falling price and rising institutional liquidity is the confirmation that the next probable move is bullish, and that we should focus on the buy.
Layer 3: the VWAP as precise target
We have the direction (buy) and the value area. To refine the target we add the VWAP (Volume Weighted Average Price), a volume-weighted moving average. Anchoring it from the high of the move, the VWAP gives us a line that marks the target more precisely, hand in hand with the Volume Profile's value area.
With the target defined, we enter. The trade had two entries: the first could be managed to break even by moving the stop or taking partial profits; the second offered a second chance to position. Price begins its rally and approaches the value area.
The market maker's cycle: from -2 to +2
As price rises and nears the target, we observe something important on the system's scale. Price traveled from the negative 2 zone — our threshold in the model — to the positive 2 zone. For us, that full journey from -2 to +2 is a Market Maker cycle.
When price reaches the +2 zone, several signals align: price hits the VWAP, touches the Volume Profile value area, and the Self reaches positive 2. And something else — now the Big Guy line no longer accompanies the rise. Price makes a fresh high but institutional liquidity is divergent: it's falling while price rises. The institutions are now selling. The cycle inverts, and we start looking for the sell.
The liquidity cross: the objective exit signal
Here's the most valuable contribution of this trade. When we were in the sell, an event appeared that in our system is very important: the liquidity cross.
The liquidity cross occurs when the Self (price on the scale) crosses the Big Guy line. At that moment, the signal is clear and objective: exit or book profits. It's not an interpretation or a hunch — it's a visible cross on the chart. That objectivity is what makes it so valuable, very different from exit decisions based on intuition.
When the cross occurs, we close the trade or take partial profits in case a retracement comes. And if price drops a bit more to the VWAP zone and the difference between the lines widens, that's the final confirmation it was time to exit.
The core idea
Two successful trades — a buy and then a sell — came from combining four tools: Volume Profile for the value area and target, the Big Guy's liquidity for institutional direction, the VWAP for the precise target, and the liquidity cross for the objective exit. None works alone; together, they turn an oil move into a readable scenario with entries and exits defined by data, not emotions.
This is the kind of analysis we do every day in our Trading Room, combining Volume Profile, VWAP, market liquidity, and Elliott Wave into a powerful combination.
Author

Juan Maldonado
Elliott Wave Street
Juan Maldonado has a University degree in Finance, and Foreign trade started his trading career in 2008. Since 2010 has been analyzing the markets using Elliott Wave with different strategies to spot high probability trades.














