Bitcoin Weekly Forecast: BTC retreats as macro headwinds grow
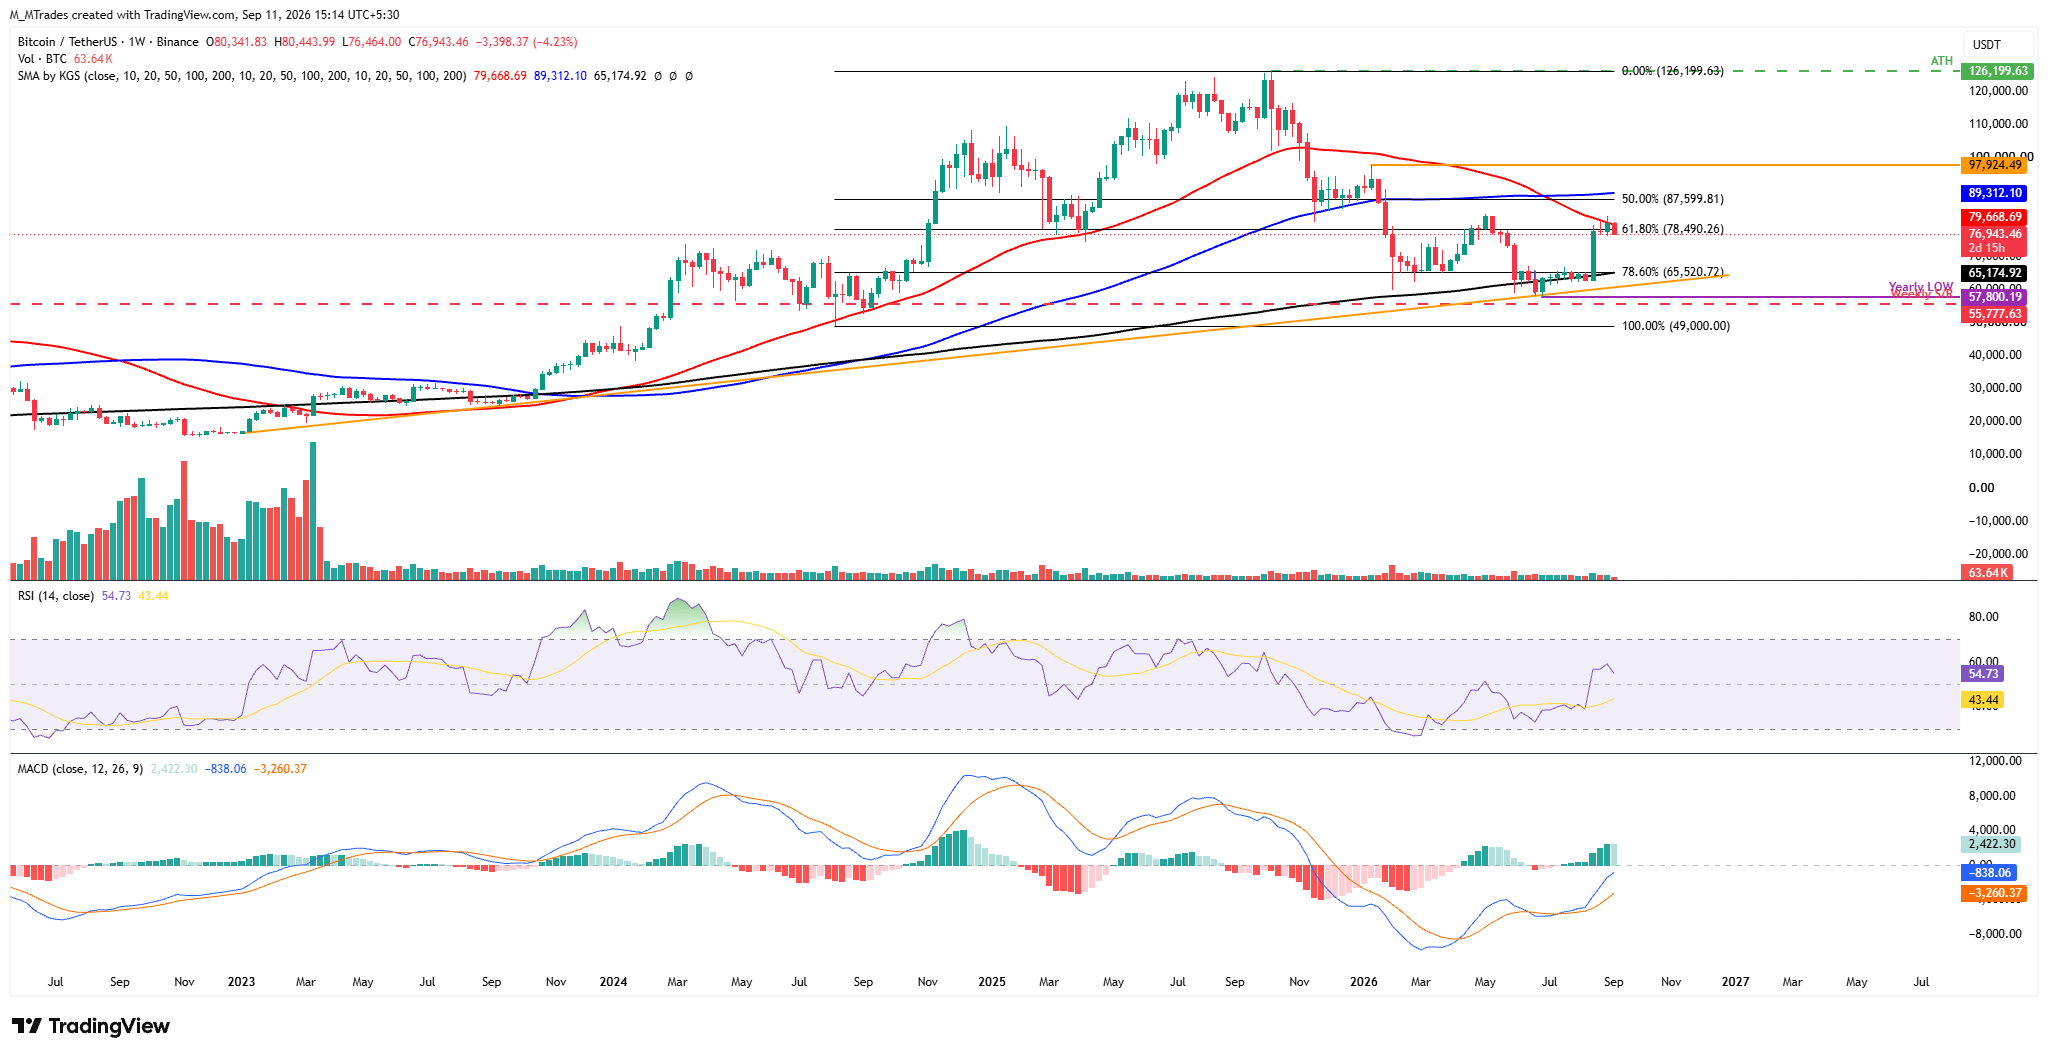
- Bitcoin fell over 4% this week, trading around $76,900 on Friday after failing to close above the 50-week SMA near $79,700.
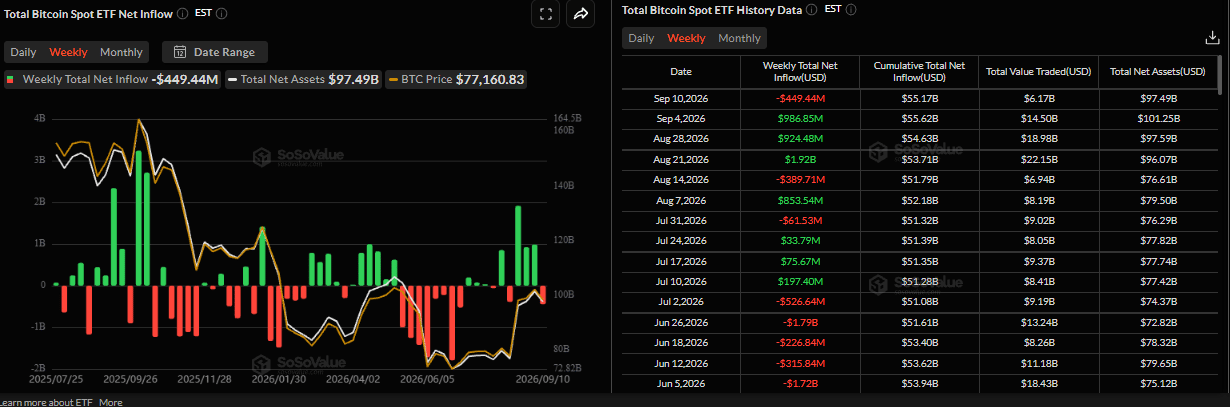
- US-listed spot ETFs are on track to snap a three-week inflow streak, recording $449.44 million in net outflows through Thursday.

US CPI held steady at 3.4% in August, in line with market expectations.
Bitcoin (BTC) remains under pressure, down over 4% this week and trading around $76,900 at the time of writing on Friday. Institutional demand shows signs of weakness as spot BTC Exchange Traded Funds (ETFs) are on track to end their three-week inflow streak, recording nearly $500 million in net outflows through Thursday.
Institutional demand cools down
Institutional demand for Bitcoin shows early signs of weakness so far this week. SoSoValue data showed spot ETFs are on track to snap a three-week inflow streak, recording $449.44 million in net outflows through Thursday. If these withdrawals continue and intensify on Friday, BTC could see further correction.
US CPI holds steady
The US Bureau of Labor Statistics (BLS) has released the United States Consumer Price Index (CPI), which held steady at 3.4% YoY in August, meeting market expectations.
On a monthly basis, the CPI rose 0.4% after a 0.1% increase the previous month. Core CPI, which excludes volatile food and energy prices, rose 0.3% monthly, above the market expectation of 0.2%, and 2.4% YoY, down slightly from 2.5% in July.
The CME FedWatch tool shows the probability of the Federal Reserve (Fed) tightening its monetary policy accelerating to 85% on Friday, up from 72% the previous day. The consensus is now higher that the central bank will raise interest rates to the 3.75%-4.00% range on Wednesday. Stricter monetary policy rarely favors risk assets; hence, the prevailing volatility could persist.

Fresh Middle East tensions fuel oil and cap BTC
Escalating tensions between the US and Iran near the Strait of Hormuz continue to lift energy prices, dampen risk appetite and weigh on the Crypto King.
Iran said that it has attacked 10 ships around the Strait of Hormuz after the US announced it had sunk five Iranian oil tankers. Moreover, Iran-backed Houthis in Yemen seized the crucial Red Sea city of Mocha, expanding control over the strategic Bab el-Mandeb Strait and adding to growing market concerns about a prolonged disruption to oil supplies.
The US President Donald Trump said that the war with Iran will likely continue until after the November US midterm elections.
These developments have shot crude oil prices to the highest level since May 21, keeping the geopolitical risk premium elevated and increasing pressure on BTC.
Bitcoin technical outlook: Fails to close above 50-week SMA
The Crypto King faced rejection from the 50-week Simple Moving Average (SMA) at $79,668 this week, correcting over 4% and trading at $76,943 at the time of writing on Friday.
If BTC continues its correction and the 50-day SMA at $79,668 holds as resistance, the Crypto King could extend the decline toward the key psychological level of $70,000.
The Relative Strength Index (RSI) on the weekly chart around 55 shows mildly positive momentum without reaching overbought conditions. At the same time, the Moving Average Convergence Divergence (MACD) remains firmly in positive territory, hinting that upside pressure persists despite nearby resistance.
On the other hand, if BTC recovers and closes above the 50-week SMA at $79,668 on a weekly basis, it could extend the rally toward the 50% Fibonacci retracement level at $87,599 (drawn from the August 2024 low of $49,000 to the October 2025 record high of $126,199), followed by the 100-week SMA at $89,312.
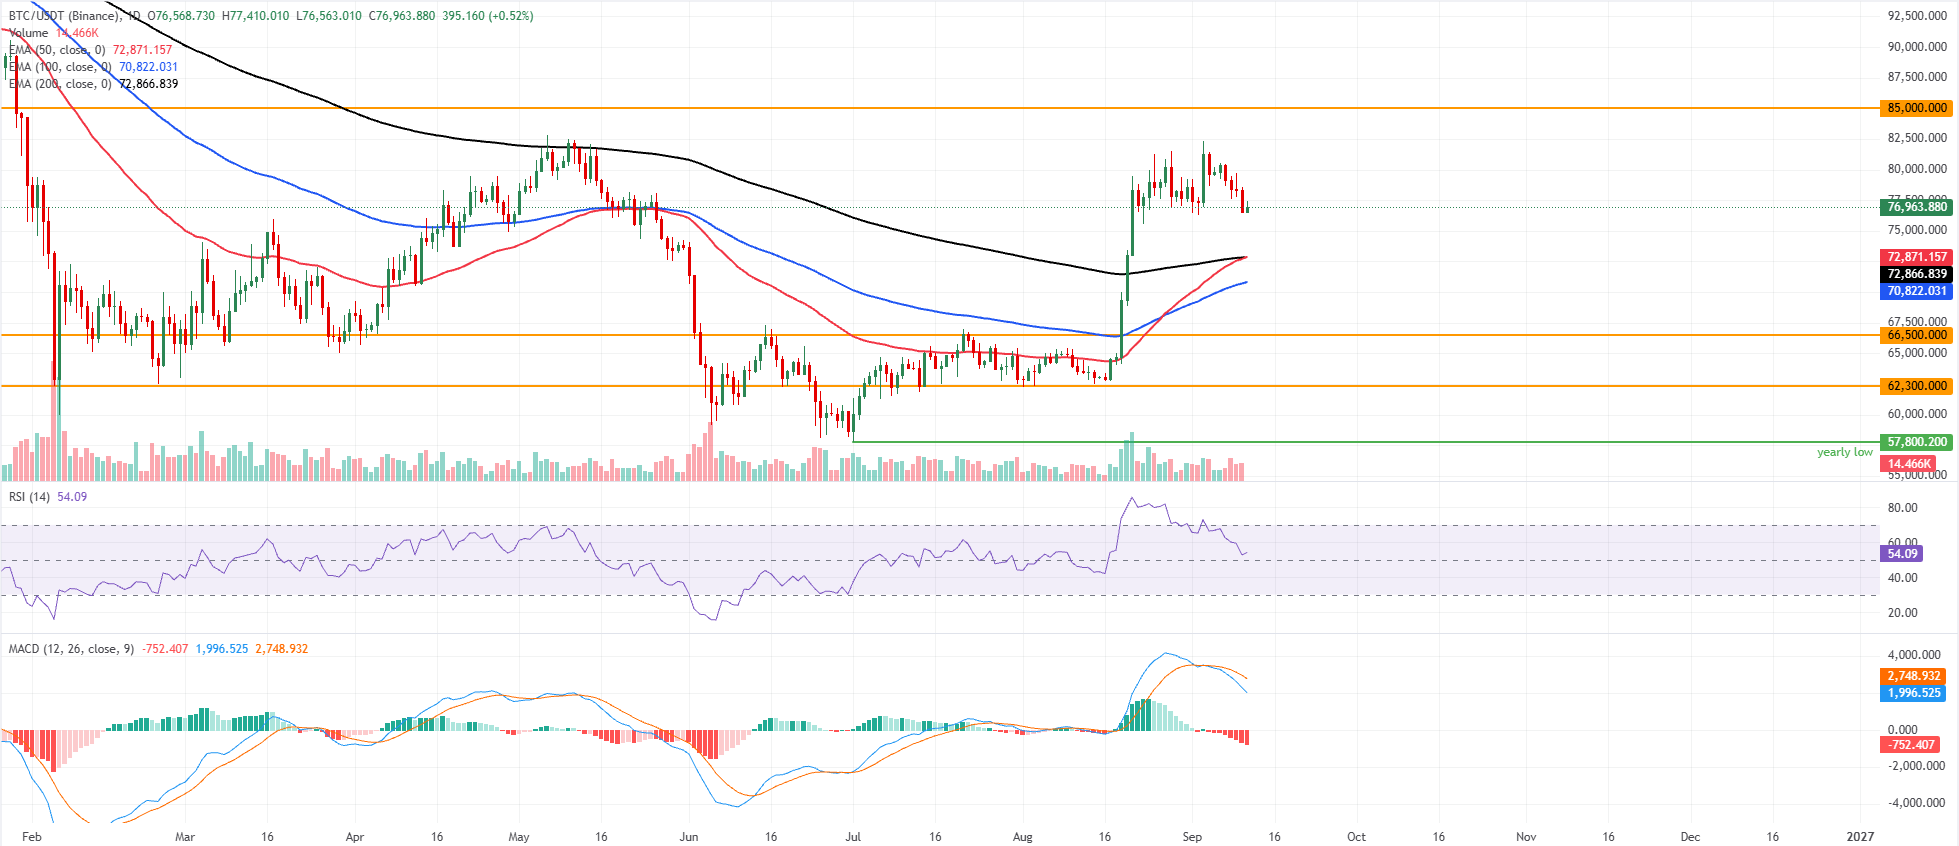
On the daily chart, BTC holds a constructive bullish bias as it remains firmly above the 50-day, 100-day, and 200-day Exponential Moving Averages (EMAs), clustered between roughly $70,800 and $72,900. This configuration suggests the broader uptrend is intact despite the recent pullback.
The RSI at about 54 has eased out of overbought territory and now signals neutral-to-positive momentum. At the same time, the MACD stays below zero, suggesting upside impetus is moderating but not yet reversing the prevailing bullish structure.
On the topside, initial resistance sits at the horizontal barrier near $85,000, capping the immediate bullish extension unless buyers can secure a clear daily close above it.
On the downside, first demand appears around the EMAs cluster, with the 200-day EMA near $72,866 and the 50-day EMA near $72,871 providing layered dynamic support, followed by the 100-day EMA around $70,822. Below that, horizontal supports sit at $66,500 and then $62,300, levels that would likely attract dip-buying interest if a deeper correction unfolds.
(The technical analysis of this story was written with the help of an AI tool. Know more.)
Bitcoin, altcoins, stablecoins FAQs
Bitcoin is the largest cryptocurrency by market capitalization, a virtual currency designed to serve as money. This form of payment cannot be controlled by any one person, group, or entity, which eliminates the need for third-party participation during financial transactions.
Altcoins are any cryptocurrency apart from Bitcoin, but some also regard Ethereum as a non-altcoin because it is from these two cryptocurrencies that forking happens. If this is true, then Litecoin is the first altcoin, forked from the Bitcoin protocol and, therefore, an “improved” version of it.
Stablecoins are cryptocurrencies designed to have a stable price, with their value backed by a reserve of the asset it represents. To achieve this, the value of any one stablecoin is pegged to a commodity or financial instrument, such as the US Dollar (USD), with its supply regulated by an algorithm or demand. The main goal of stablecoins is to provide an on/off-ramp for investors willing to trade and invest in cryptocurrencies. Stablecoins also allow investors to store value since cryptocurrencies, in general, are subject to volatility.
Bitcoin dominance is the ratio of Bitcoin's market capitalization to the total market capitalization of all cryptocurrencies combined. It provides a clear picture of Bitcoin’s interest among investors. A high BTC dominance typically happens before and during a bull run, in which investors resort to investing in relatively stable and high market capitalization cryptocurrency like Bitcoin. A drop in BTC dominance usually means that investors are moving their capital and/or profits to altcoins in a quest for higher returns, which usually triggers an explosion of altcoin rallies.
Author

Manish Chhetri
FXStreet
Manish Chhetri is a crypto specialist with over four years of experience in the cryptocurrency industry.