How to detect the institutional volume that signals market turning points [Video]
![How to detect the institutional volume that signals market turning points [Video]](https://editorial.fxsstatic.com/images/i/Equity-Index_Nasdaq-1.jpg)
You add volume to your chart and see a tall bar. 50,000 contracts traded during that session. That tells you activity was high. But it doesn't tell you the one thing that actually matters: were the institutions buying or selling?
This is the fundamental problem with conventional volume analysis — and it's the reason most traders misread turning points. In this breakdown, I walk you through the step-by-step process we use to isolate institutional volume and detect the exact moment institutions stop selling and begin accumulating. We'll use a real example on the Nasdaq daily chart where this approach identified the market bottom faster than the MACD or any other indicator.
The Three Layers of Volume — And Why Most Traders Stop Too Early
Most traders interact with volume at the surface level. They see a large bar and conclude that "a lot of activity happened." Some go a step further and break down buy volume versus sell volume. But even that second layer isn't enough to make consistently profitable decisions.
Here's why:
Layer 1 — Total Volume
When you look at a volume bar on your chart, you're seeing the total number of contracts traded during that session. Whether you're trading CME futures or using tick volume as a proxy in OTC markets like crypto or forex, the number represents aggregate activity. It tells you how much was traded, but nothing about who was trading or what side they were on.
Layer 2 — Buy vs. Sell Breakdown
You can access exchange data to determine that, say, 60% of the volume was buying, and 40% was selling. That's more useful — but it still doesn't answer the critical question. Within that 60% buy volume, how much was institutional? How much was retail? Were the large players driving the buying, or were they offloading positions to eager retail buyers?
Layer 3 — Institutional Positioning
This is the layer that changes everything. Knowing which side the institutions are on — not just the aggregate market — gives you the directional edge that total volume and buy/sell ratios cannot provide. This is where our VolWaves AI volume indicator operates.
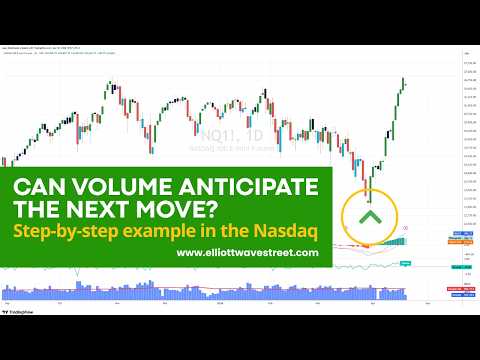
A real example: Detecting the Nasdaq bottom
Let me show you how this works with a concrete example on the Nasdaq futures daily chart.
As the Nasdaq was declining, the volume on our institutional indicator was increasing to the downside. This told us something clear: the institutions were aligned with the bearish trend. They were supporting the move lower. At that point, attempting to buy would have been the worst possible decision — you would have been trading directly against institutional flow.
This is the first critical insight: institutional volume doesn't just show you entries. It keeps you out of bad trades. As long as institutional volume is aligned with the trend, you have no business trading against it.
The Absorption Signal
Then something changed. The price made a new low — but the institutional volume told a completely different story. At this new low, the institutions were buying. The volume shifted from distribution to absorption.
This is the signal most traders never see because conventional volume tools can't isolate it. Total volume might have looked bearish. The price action certainly looked bearish. But underneath the surface, the institutions had flipped sides. They were buying at a discount while most traders were still selling or frozen in fear.
The Result
The signal appeared around the 23,000 level on the Nasdaq. What followed was a move to 26,800 — nearly 3,800 points of upside from a single volume-based detection of the turning point.
And here's the key: this signal arrived faster than the MACD. In our previous video, we showed how the MACD crossover on the daily chart identified this same bottom. That signal was effective, but it came later. The institutional volume shift showed the turning point in real time, as it was happening, not after the confirmation lag that oscillators inherently carry.
How this technique connects to the MACD
This raises a natural question: if the volume signal is faster, why use the MACD at all?
Because they serve different purposes at different stages of the trade:
- VolWaves AI volume indicator detects the turning point — when institutions flip from selling to buying. This is your earliest signal that the trend may be ending.
- MACD confirms the cycle change and helps you stay in the trade. Once the MACD crosses above the signal line on the daily, you have confirmation that the momentum has shifted — and as we showed in the previous video, the MACD can hold above the signal line for thousands of points of directional movement.
The combination is powerful: volume gets you in early, MACD keeps you in long.
Applicability across markets and timeframes
One of the most practical aspects of this technique is its versatility. While we demonstrated it on the Nasdaq daily chart, the same approach works across:
- Any timeframe: Weekly, daily, 4-hour, 30-minute, even 5-minute charts. The institutional footprint is visible wherever there's sufficient volume data.
- Any instrument: Futures, equities, crypto, forex. For OTC markets, tick volume serves as a reliable proxy — approximately 80% correlated with actual volume — and the technique adapts accordingly.
The principle remains the same regardless of market or timeframe: when institutional volume diverges from price, a turning point is likely near. When institutions are buying while the price is making new lows, the bottom is forming — even if it doesn't look like it on the surface.
What this means for your trading
The practical takeaway is straightforward: stop relying on total volume to make directional decisions. Total volume tells you activity levels, not institutional intent. And institutional intent is what moves markets.
If you can identify the moment institutions shift from one side to the other, you can position yourself alongside the largest and most informed participants in the market — before the move becomes obvious to everyone else.
This is exactly what we do every day in our trading room. We track institutional volume across multiple instruments and timeframes, identifying these absorption and distribution patterns in real time so our members can act on them as they develop.
Author

Juan Maldonado
Elliott Wave Street
Juan Maldonado has a University degree in Finance, and Foreign trade started his trading career in 2008. Since 2010 has been analyzing the markets using Elliott Wave with different strategies to spot high probability trades.


