Zcash Price Forecast: ZEC faces correction risks as retail activity rises, momentum weakens
- Zcash trades in red on Tuesday, erasing the 5% gain registered the previous day.
- On-chain data shows signs of concern as retail activity increases, often indicating short-term market overheating.
- The RSI and price action show a bearish divergence, adding to the likelihood of a correction ahead.

Zcash (ZEC) price trades in red below $330 at the time of writing on Tuesday, showing early signs of cooling after a sharp rally earlier in the week. The privacy-focused cryptocurrency, onchain data shows a rise in retail activity, a trend often linked to short-term market tops. Adding to this bearish outlook, the technical indicators are flashing bearish divergence, suggesting weakening momentum and the potential for a near-term correction.
Zcash's rising retail activity hints at a short-term correction
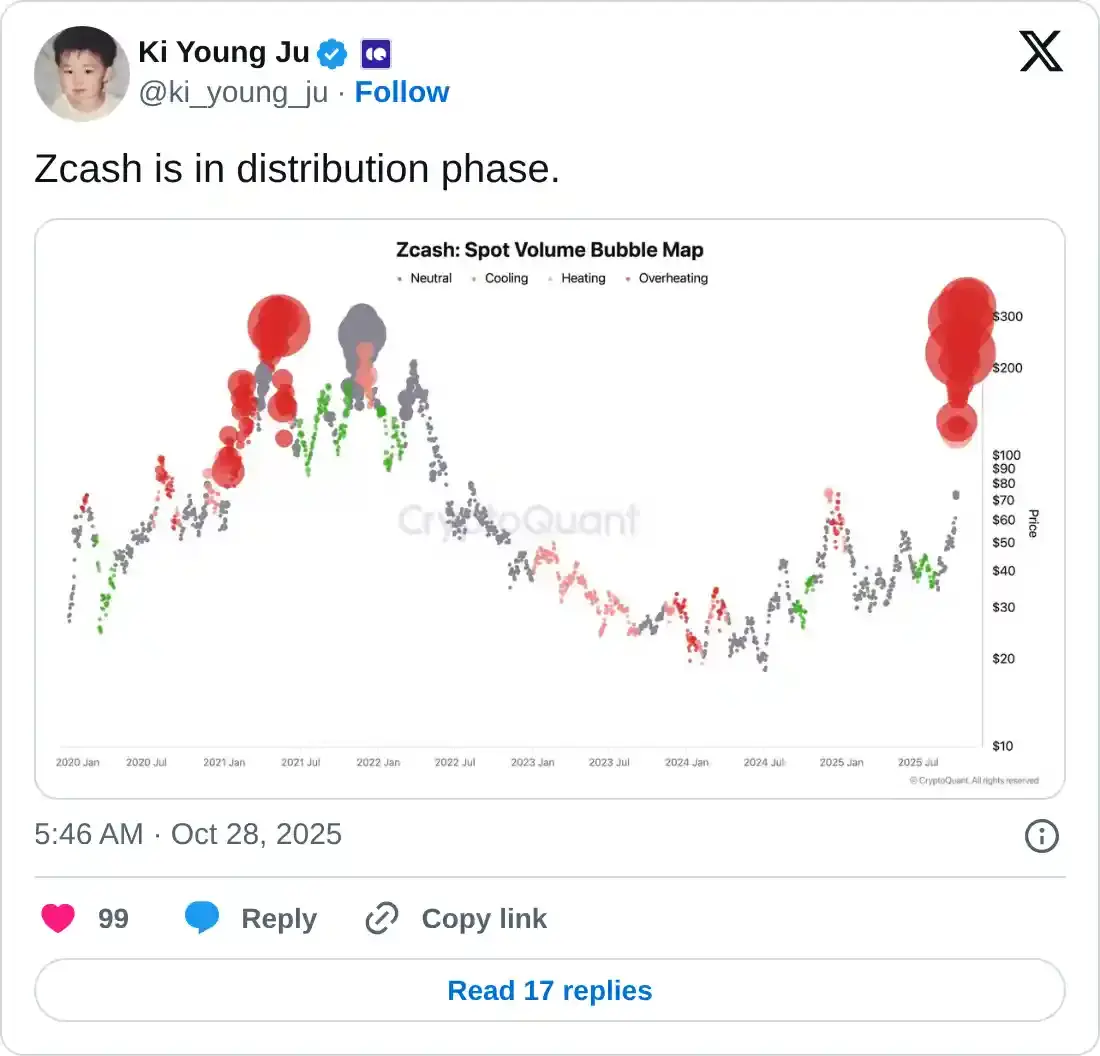
Ki Young Ju, Founder and CEO of on-chain and market data platform CryptoQuant, shared on X on Tuesday that Zcash appears to be in its distribution phase.
Ju cautioned investors, saying, “Sorry, but you’re retail if you’re buying Zcash now,” suggesting ZEC may be entering a period of profit-taking after recent gains.
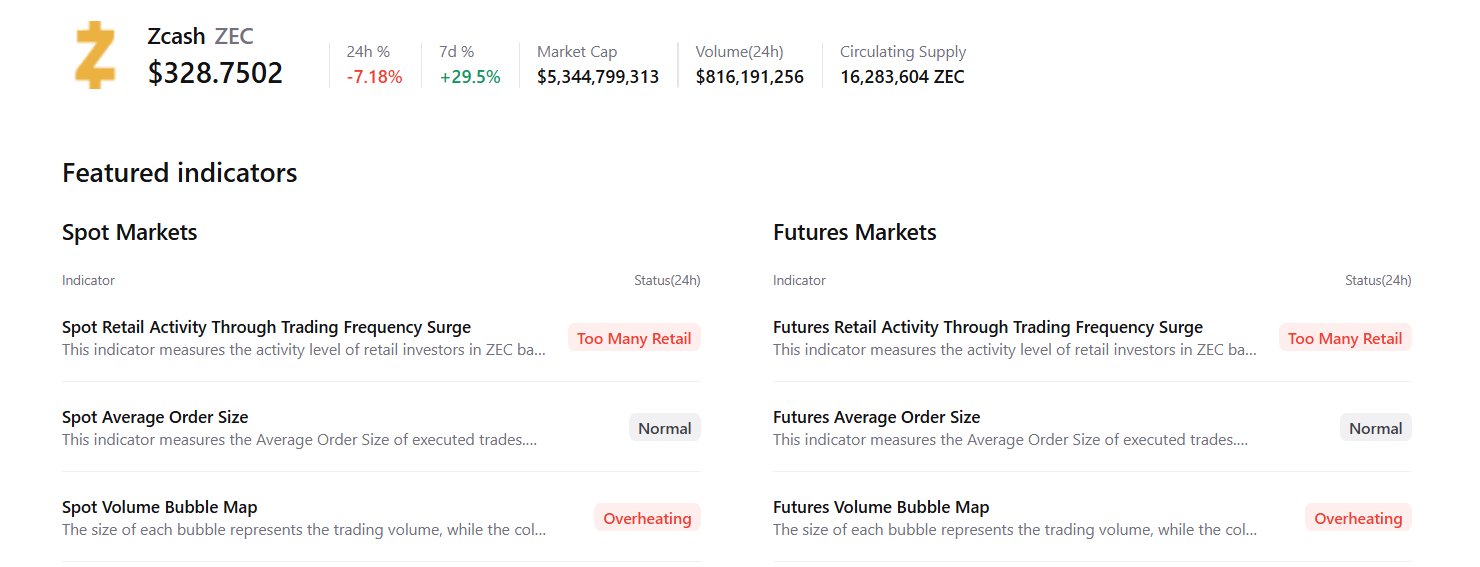
Additionally, CryptoQuant’s summary data further supports the bearish outlook, with both the spot and futures markets showing signs of retail activity and overheating conditions, signaling a potential correction ahead.
Zcash Price Forecast: ZEC’s RSI indicator shows bearish divergence
Zcash's price rose more than 37% in the previous week, and on Monday, it extended those gains by 5%. At the time of writing on Tuesday, ZEC trades slightly below $230.
Moreover, on the daily chart, ZEC's price shows a bearish divergence in the Relative Strength Index (RSI). The formation of a higher high on Monday contrasts with the RSI’s low highs during the same period. This development is called a bearish divergence and often signals a trend reversal after recent upward momentum.
If ZEC faces a correction, it could extend the decline toward the weekly support at $260.42.
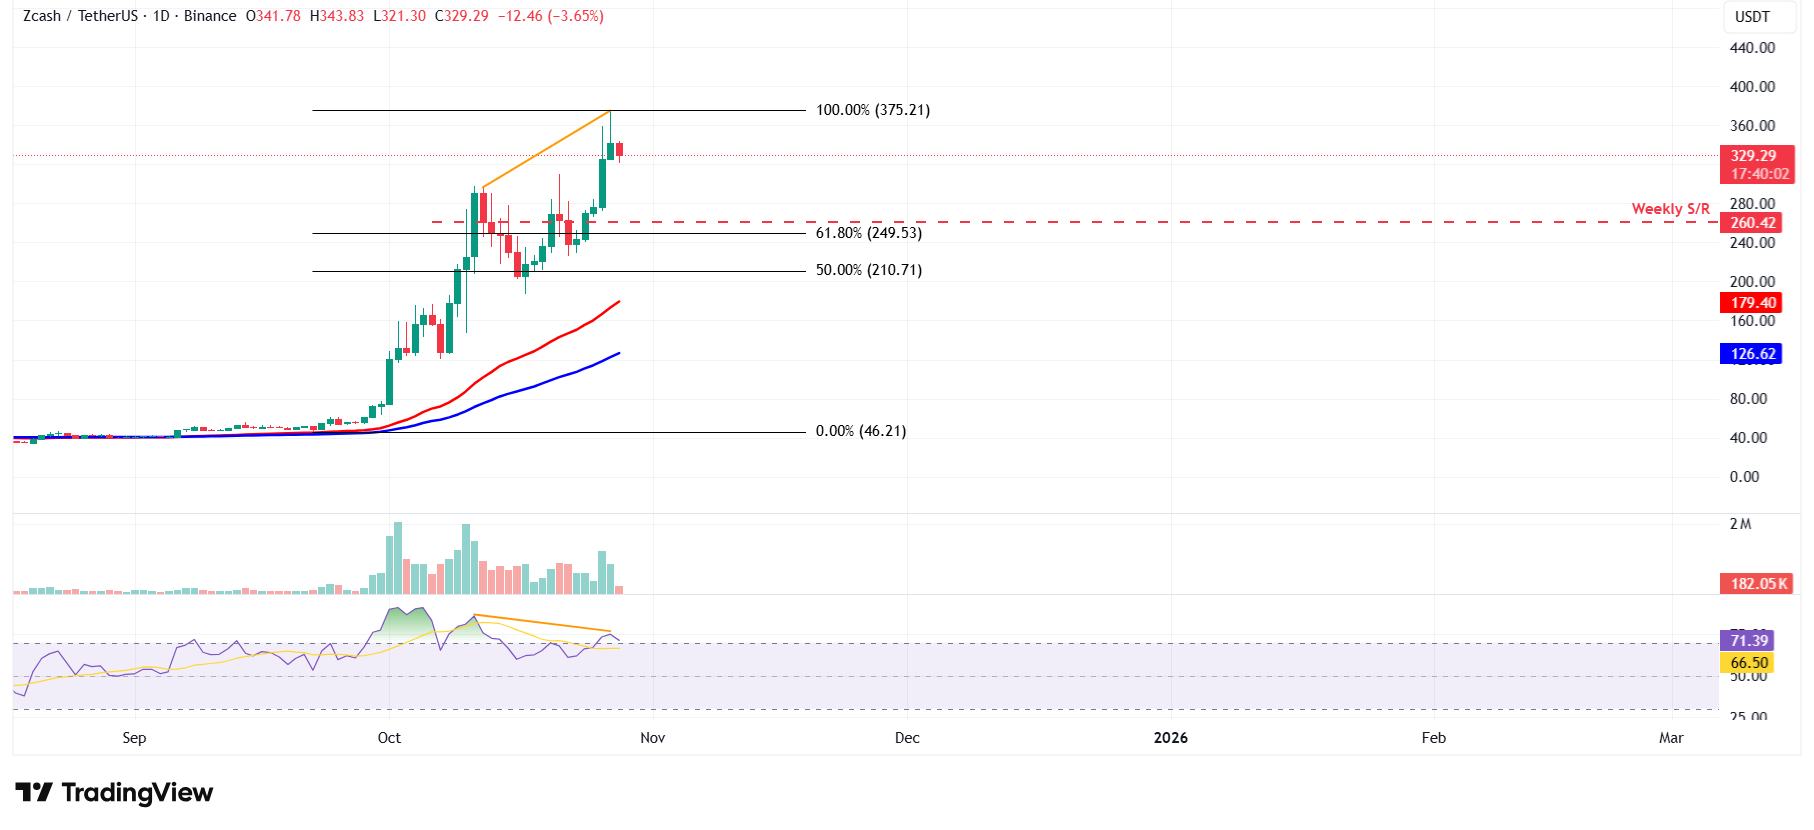
ZEC/USDT daily chart
On the other hand, if ZEC recovers, it could extend the rally toward Monday’s high of $375.21.
Author

Manish Chhetri
FXStreet
Manish Chhetri is a crypto specialist with over four years of experience in the cryptocurrency industry.



