Zcash Price Analysis: Bulls take over after ZEC flashes buy signal
- Zcash will be going through a halving in a little over 53 days.
- The price faces a strong resistance wall at $65, as per the IntoTheBlock’s IOMAP.

Zcash has a little over 53 days left before it goes through the next halving event. Similar to Bitcoin, Zcash also goes through a halving event every four years. The current block reward happens to be 6.25 ZEC, which will drop to 3.125 ZEC following the halving. The halving process is done to keep the supply of the coins in check.
As such, this should incentivize the holders to strengthen their positions as much as they possibly can. Ryan Selkis, the founder at Messari crypto, seems to be one of those investors precisely doing that.
Just added 40% to my $ZEC position.
— Ryan Selkis (@twobitidiot) September 23, 2020
Now, how is this affecting the price, if at all? Let’s take a look.
ZEC/USD daily chart
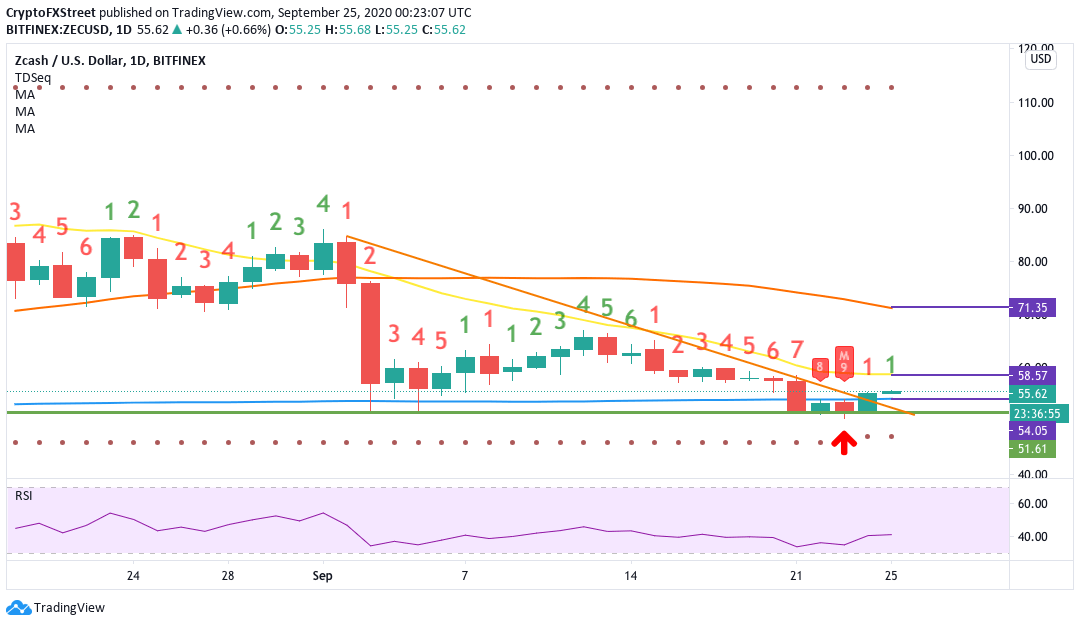
ZEC/USD daily chart flashed the buy signal on the TD sequential. Following that, the buyers pushed the price above the descending triangle formation. In the process, ZEC managed to break above the SMA 200 curve. Up next, the price should aim for the SMA 20 curve, which it can do so by pushing up to $57.55.
To get a clearer picture of this whole scenario, let’s check out the IntoTheBlock’s “In/Out of the Money Around Price” (IOMAP) model.
ZEC IOMAP
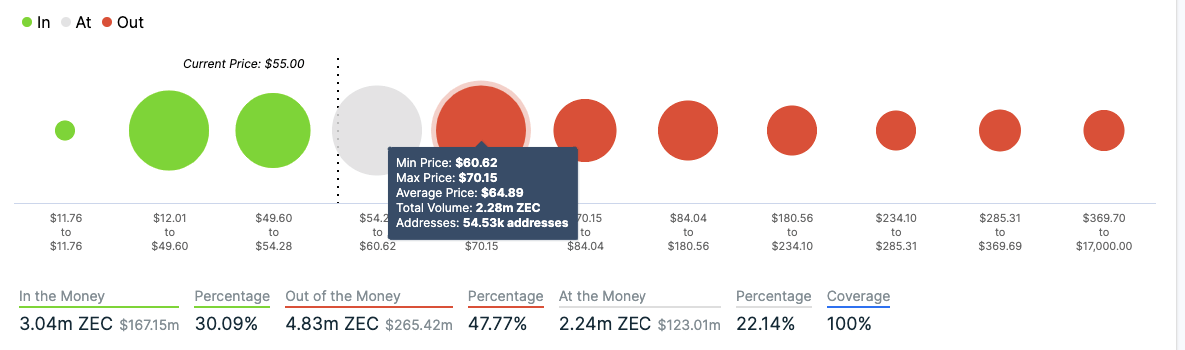
As per the IOMAP, the privacy coin is currently sandwiched between strong resistance and support levels. On the upside, there is a strong resistance wall at $65, where 54.5k addresses had previously bought 2.28M ZEC coins. If the buyers gain enough momentum to break through this level, the subsequent resistance walls are progressively weaker.
On the downside, the price has sufficiently strong support walls at $51.50 and $30.50 to absorb any selling pressure.
ZEC/USD 12-hour chart
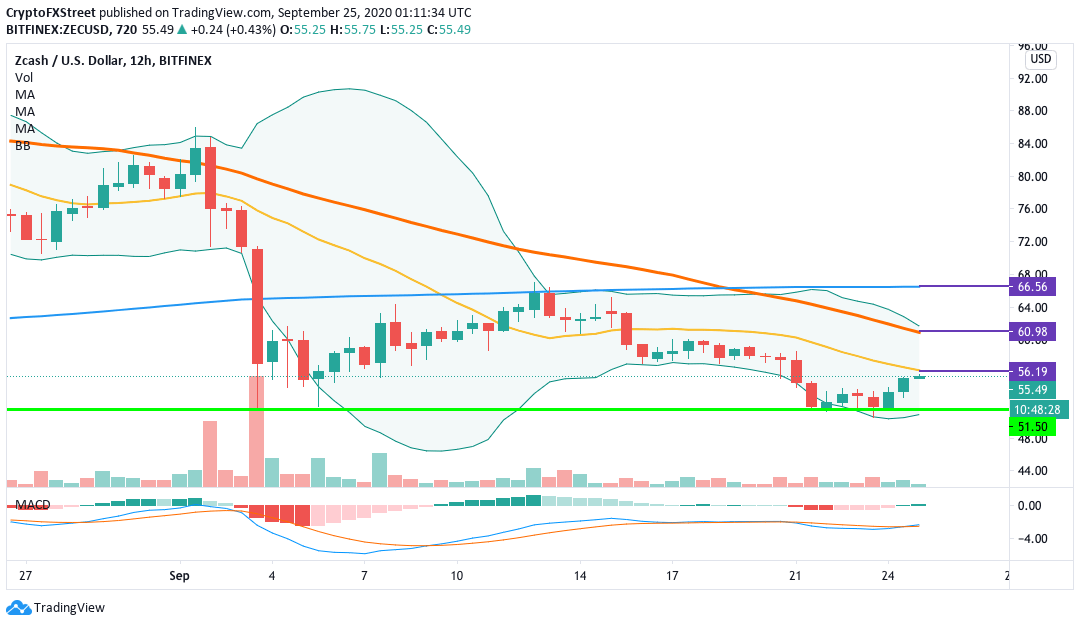
ZEC has bounced up from the $51.50 support line and managed to have three bullish sessions in the 12-hour chart. Currently, the price is looking to cross above the SMA 20 curve ($56.20). The MACD shows that market momentum has reversed from bearish to bullish. The buyers must leverage this momentum to break past SMA 20 and then aim for the SMA 50 ($61).
ZEC 4-hour chart
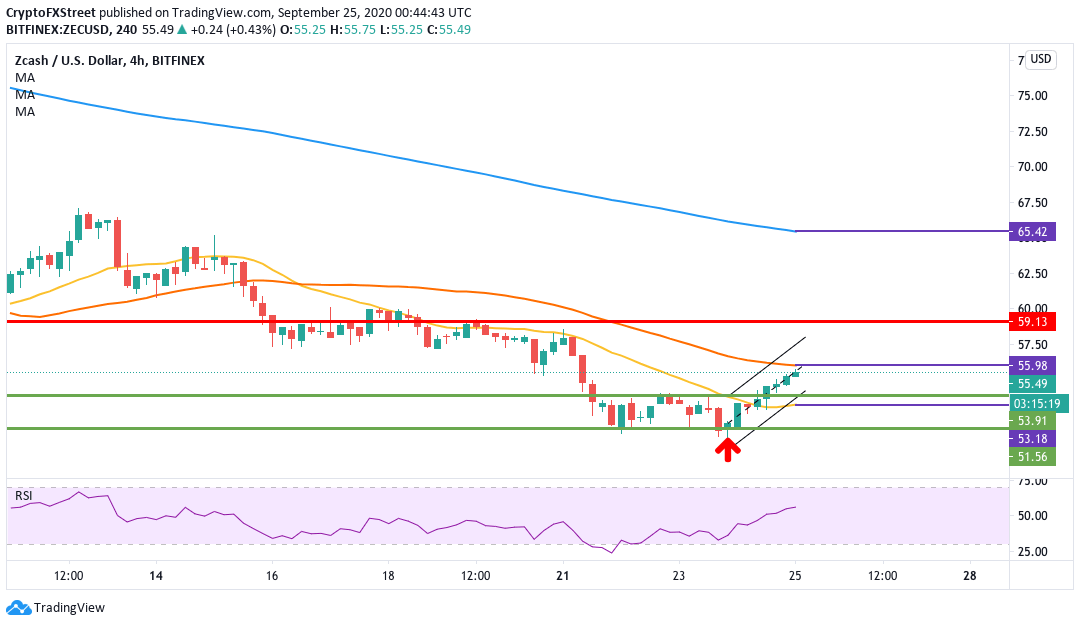
ZEC/USD has been moving up in a flag formation after the price charted the morning star pattern. The price will look to break above the SMA 50 ($56). The relative strength index (RSI) is hovering around 56, showing that it still has some room to move till it reaches the overbought zone. This should give the bulls the license to go for the kill, pass the SMA 50 and aim for the $59 resistance level.
Want to know more about what's going on in the cryptoverse? Check out our report.
Author

Rajarshi Mitra
Independent Analyst
Rajarshi entered the blockchain space in 2016. He is a blockchain researcher who has worked for Blockgeeks and has done research work for several ICOs. He gets regularly invited to give talks on the blockchain technology and cryptocurrencies.


