ZAP price recovers nearly 400% from recent lows, Holo, ELX, Siacoin, RSR also rebound

As Bitcoin (BTC) cools down for the next leg-up after exhibiting indicators of bullishness, altcoins are continuing to show strength. After a long consolidation period during the market sell-off, ZAP is rebounding and leading the altcoin market with a near-400 percent surge.
According to Poloniex data, its price reached a high of $0.0344 in an exceptional 4-day run. Among other altcoins – Holo, ELX, Siacoin, and Reserve Rights – were also prominent gainers.
The most crucial reason fueling a resurgence in Altcoins is capital rotation from investors wanting to maximize their gains. The majority of Altcoins are expected to rally now that Bitcoin has established itself and gone through the $45,000 barrier.
Indeed, many altcoins have already increased by over 50% in recent days and look set for continued gains.
ZAP/USDT spikes nearly 400% from lows in a 4-day run
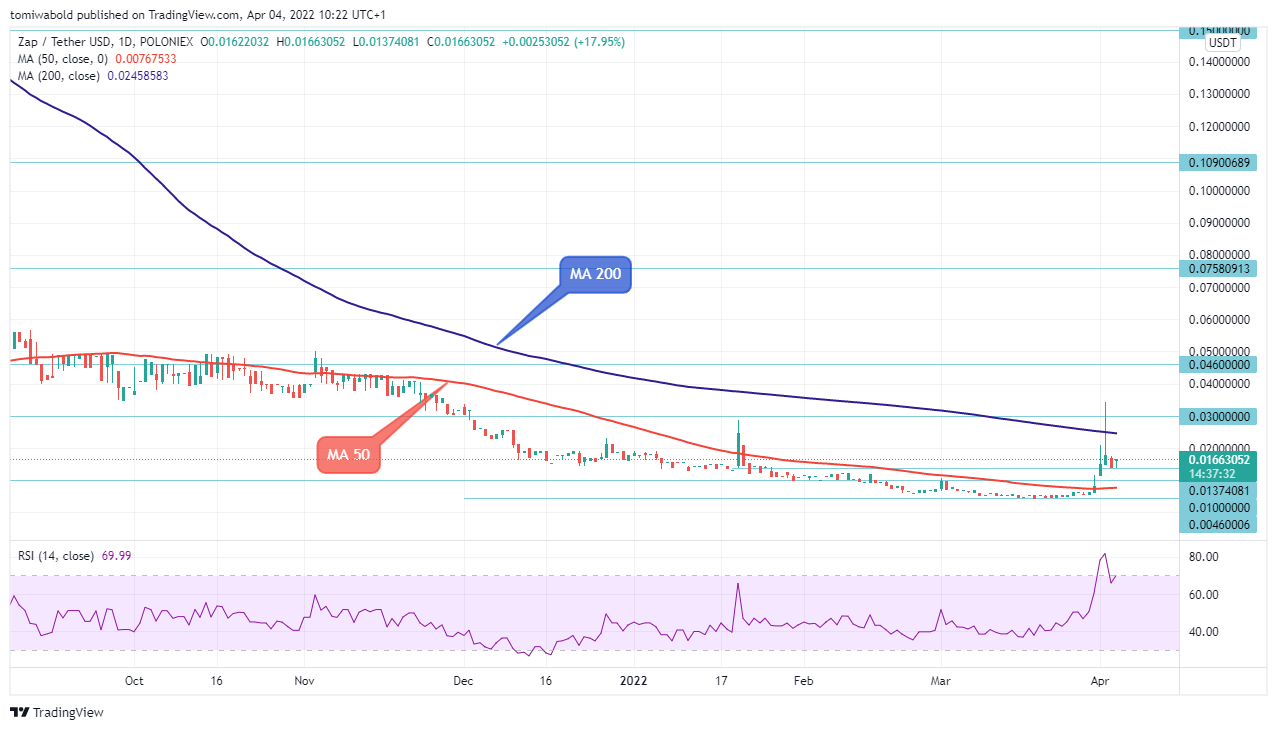
ZAP/USDT Daily Chart
The ZAP/USDT pair was trading at $0.0166 at the time of this analysis, up from the March 2022 lows of $0.0046, marking a gain of almost 400%. As bulls shrug off weak selling pressure, ZAP broke the key $0.030 barrier but later fell amid market consolidation, with a positive indication for the next rally.
Although the price retraced to establish support above the daily moving average (MA 50) at $0.0137, its bounce-off support could rekindle the bullish bias beyond the MA 200.
ZAP bulls are now pushing the price towards $0.020. The MA 50 ($0.0080) provides lower support for the pair. On the daily chart, the recent jump through the moving average (MA 200) and key barrier at $0.030 is seen as reinforcing the bullish case.
The recent momentum implies that the corrective bounce from the $0.0046 bottom could return ZAP to the bullish phase. A successful close above the $0.030 level might keep the upside traction going.
HOT/USDT bulls keep high ground past $0.006
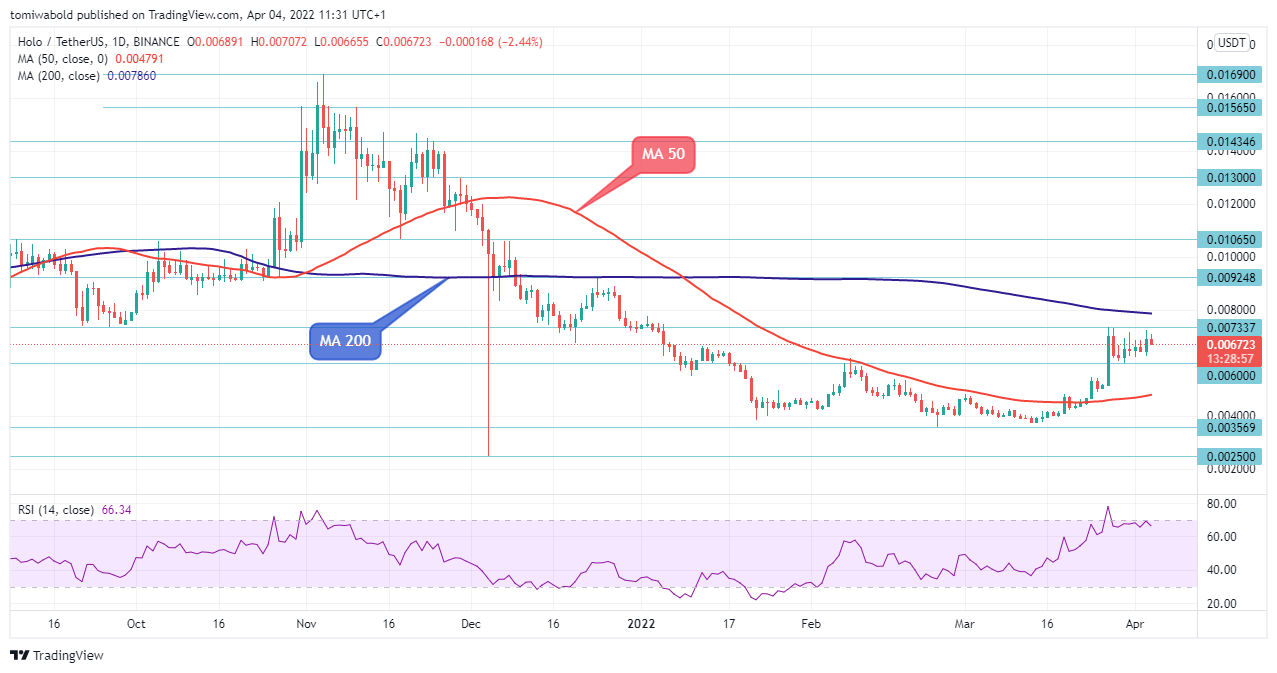
HOT/USD Daily Chart
After falling from the $0.0122 level on Dec. 1, 2021, Holo buyers are back above the daily moving average (MA 50). In February 2022, a support base was built around $0.0035, with the price mostly consolidating until larger bulls reclaimed full control above $0.006, which is a high ground past its support. The relative strength index (RSI) is flat near the overbought zone; therefore HOT/USD may remain positive despite sluggish upside traction.
HOT upticks should be kept in check by barriers at the $0.0073 horizontal level, ahead of the MA 200. The barrier which is currently around $0.008, could represent a point of resistance. If the bulls succeed, they can go after the $0.0092 barrier, which if broken would enhance upside confidence and open the door to the $0.0130–$0.0169 resistance.
SC/USDT consolidates before the next major move
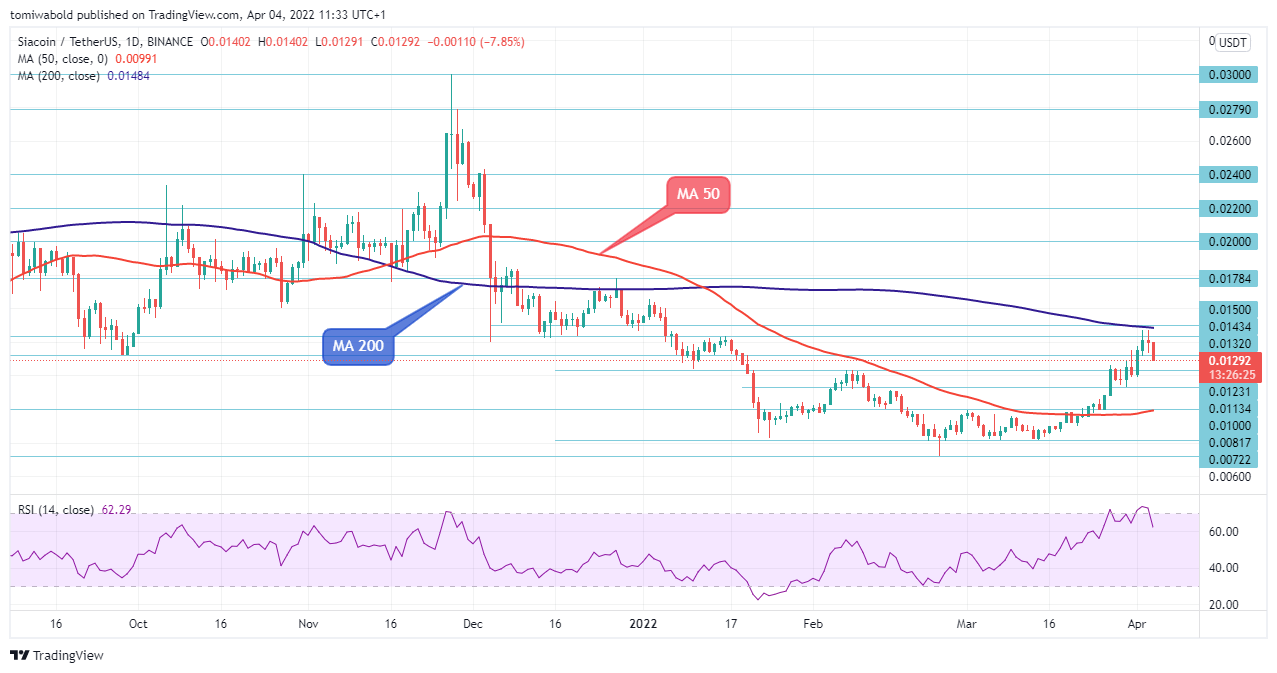
SC/USDT Daily Chart
According to the near-term oscillators, SC/USDT bulls are currently retreating below near-term barrier of $0.0150 at the moving average (MA 200). Bears, on the other side, might intensify activities and sell on rallies below the $0.0132 support.
However, if buyers can return price the over the moving average (MA 200) at $0.0150, this might be the first entry into the upside zone.
If the positive aspects diminish further, bears might push the price towards the next support at $0.010, with the lower support level at $0.0081 being the focus. On the other hand, if the bearish trend halts, the price might continue to consolidate between $0.0150 and $0.0113.
The price of SC/USDT is now exhibiting a range-like bias, and bulls must push the price above the resistance level of $0.015 to advance.
RSR/USDT sees limited pullback from local barrier
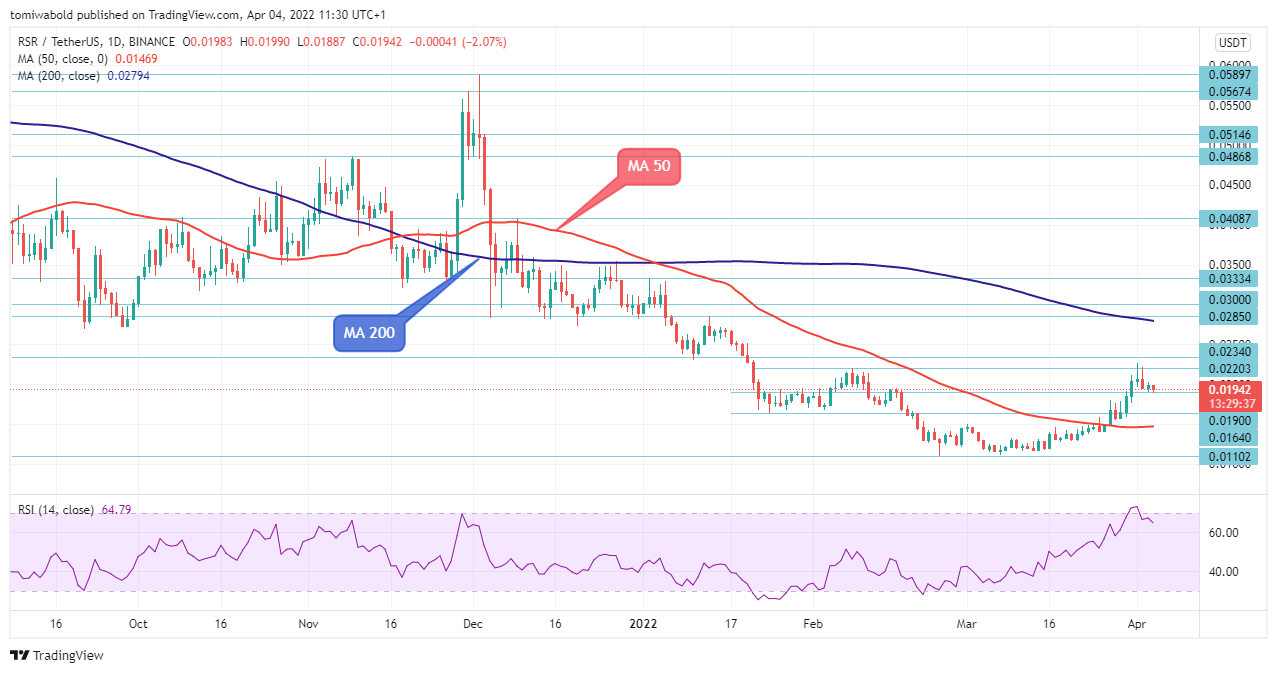
RSR/USDT Daily Chart
RSR/USDT is currently retracing from a local barrier of $0.022 after its run of 4 consecutive days of gains. Near-term supports at the $0.0190 zone are expected to hold, preserving larger bulls for a new push higher and a retest of critical resistance at the $0.028 horizontal level where the moving average (MA 200) resides.
A break lower, on the other hand, should be handled with caution because it might lead to a further drop towards $0.0164, the next crucial support level. In conclusion, due to the relative strength index (RSI) loss of strength at the overbought zone, the overall picture remains in a consolidation. Meanwhile, the congestion near the $0.0190 support level might sustain the bulls.
ELX/USDT awaits a surge in buyers
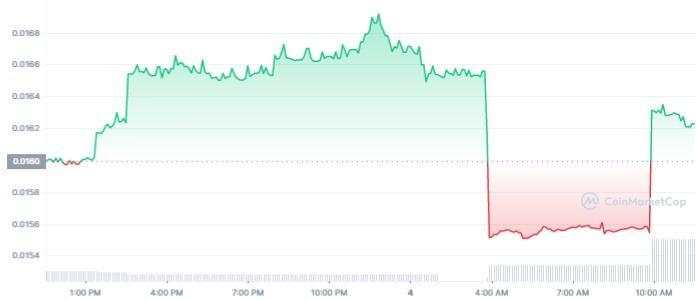
ELX/USDT Daily Price Chart The live Energy Ledger price is $0.01621 at the time of this analysis, with a 24-hour trading volume of $4,225.25. In the last 24 hours, Energy Ledger has gained nearly 2 percent of its value.
ELX is a relatively young cryptocurrency with a market capitalization per CoinMarketCap data of $1,587,181.20 and a fully diluted market capitalization of $11,632,785.88.
The maximum supply of Energy Ledger coins is 714,000,000. ELX has risen little from lows of $0.01551 in the last 24 hours to an intraday high of $0.01692. Energy Ledger Inc. plans to create ELX, the industry-standard software development platform for blockchain-based energy value trading.
Author

James Clifford
Independent Analyst
James is a tech, forex and cryptocurrency writer based in the UK. He has been a crypto enthusiast since 2015, and primarily covers market news, technical analysis, and up-and-coming blockchain projects.




