Yearn.Finance price is ready for a 12.5% breakout in the short-term
- YFI price is bounded inside a symmetrical triangle on the 30-minutes chart.
- A breakout into either direction has the potential to push YFI 10%.

YFI has been one of the top performers in the market during the past week, reaching a peak of $29,890 on November 20. The digital asset is currently trading at $25,168 and seems to be on the verge of a breakout or breakdown.
YFI awaits a potential breakout in the short-term
YFI price is trading at $25,165 inside a symmetrical triangle formed on the 30-minutes chart. The upper trendline at $25,750 is the most significant resistance level currently. A breakout above this point would be notable.
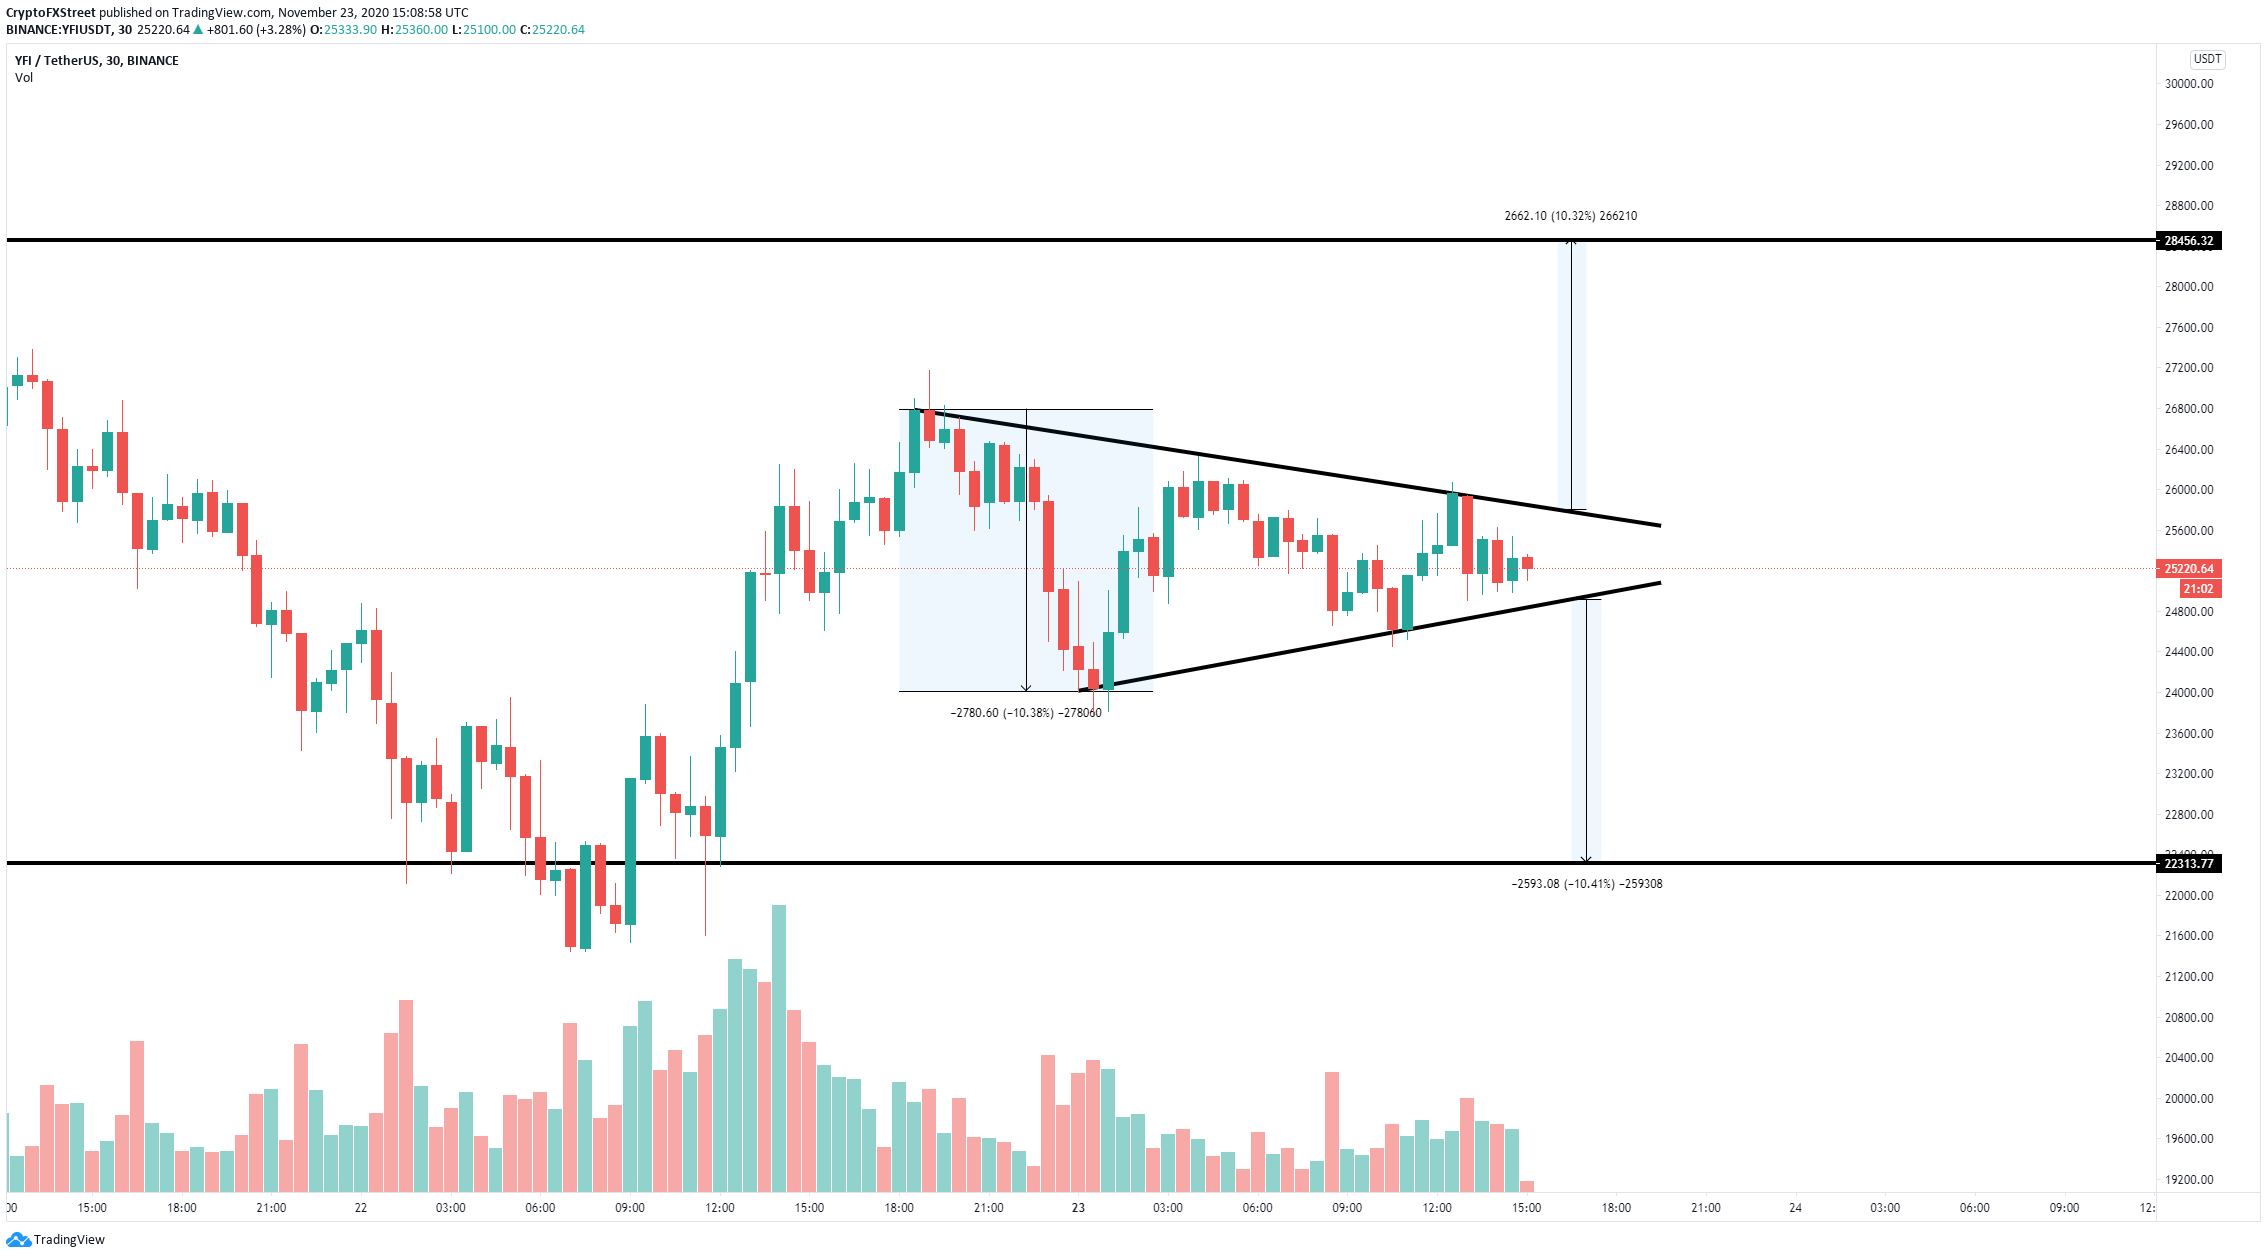
YFI/USD 30-minutes chart
Using the height of the symmetrical triangle, which is 10%, it can be determined that the bullish price target is $28,456, which would represent a similar price growth after a breakout above the resistance trendline at $25,750.
On the other hand, a breakdown below the lower trendline at $24,893 would quickly drive YFI price towards $22,313, which would also represent a 10% drop. YFI is right in the middle of the pattern currently.
Author

Lorenzo Stroe
Independent Analyst
Lorenzo is an experienced Technical Analyst and Content Writer who has been working in the cryptocurrency industry since 2012. He also has a passion for trading.


