Yearn.Finance holders are ready to dump their tokens en masse
- Yearn.Finance on-chain metrics imply that the token is ready to start the correction.
- The critical support is located on the approach to $25,000.

Yearn.Finance (YFI) has been one of the biggest gainers in the last days. The popular DeFi-token gained over 180% in less than two weeks and jumped to the 29th position in the global cryptocurrency market rating. With the current market capitalization of $818 million, it is threatening to overtake Huobi Token and Uniswap.
The price stopped within a whisker of the psychological $30,000 and retreated to $28,180 by the time of writing. Despite the setback, the token has gained over 11% on a day-to-day basis and 64% week-to-week.
On-chain metrics imply bullish party may be drawing to an end
According to Santiment, YFI holders have been moving their coins to the cryptocurrency exchanges. This trend often serves as a leading indicator for an upcoming price decrease.
The on-chain data provider reports that the daily active deposits have been growing since November 17 and reached 233 on Thursday, which is the highest level in about two weeks. It means that the army of holders ready to offload their YFI is growing.
 [11.30.03, 20 Nov, 2020]-637414595446153810.png)
YFI's Daily Active Deposits
Until recently, the increasing supply was easily absorbed by strong demand, but the situation may change this time, as the technical charts are also sending alarming signals.
TD Sequential indicator screams sell
The TD Sequential indicator presented a sell signal on YFI 4-hour and 12-hour charts, adding credence to the negative outlook. The bearish formation developed as a green nine candlestick, meaning that the price may experience a correction in the form of one to four three-day candlesticks. However, if the downside momentum gains traction, the DeFi token may start a new downward countdown towards the critical support of $25,000.
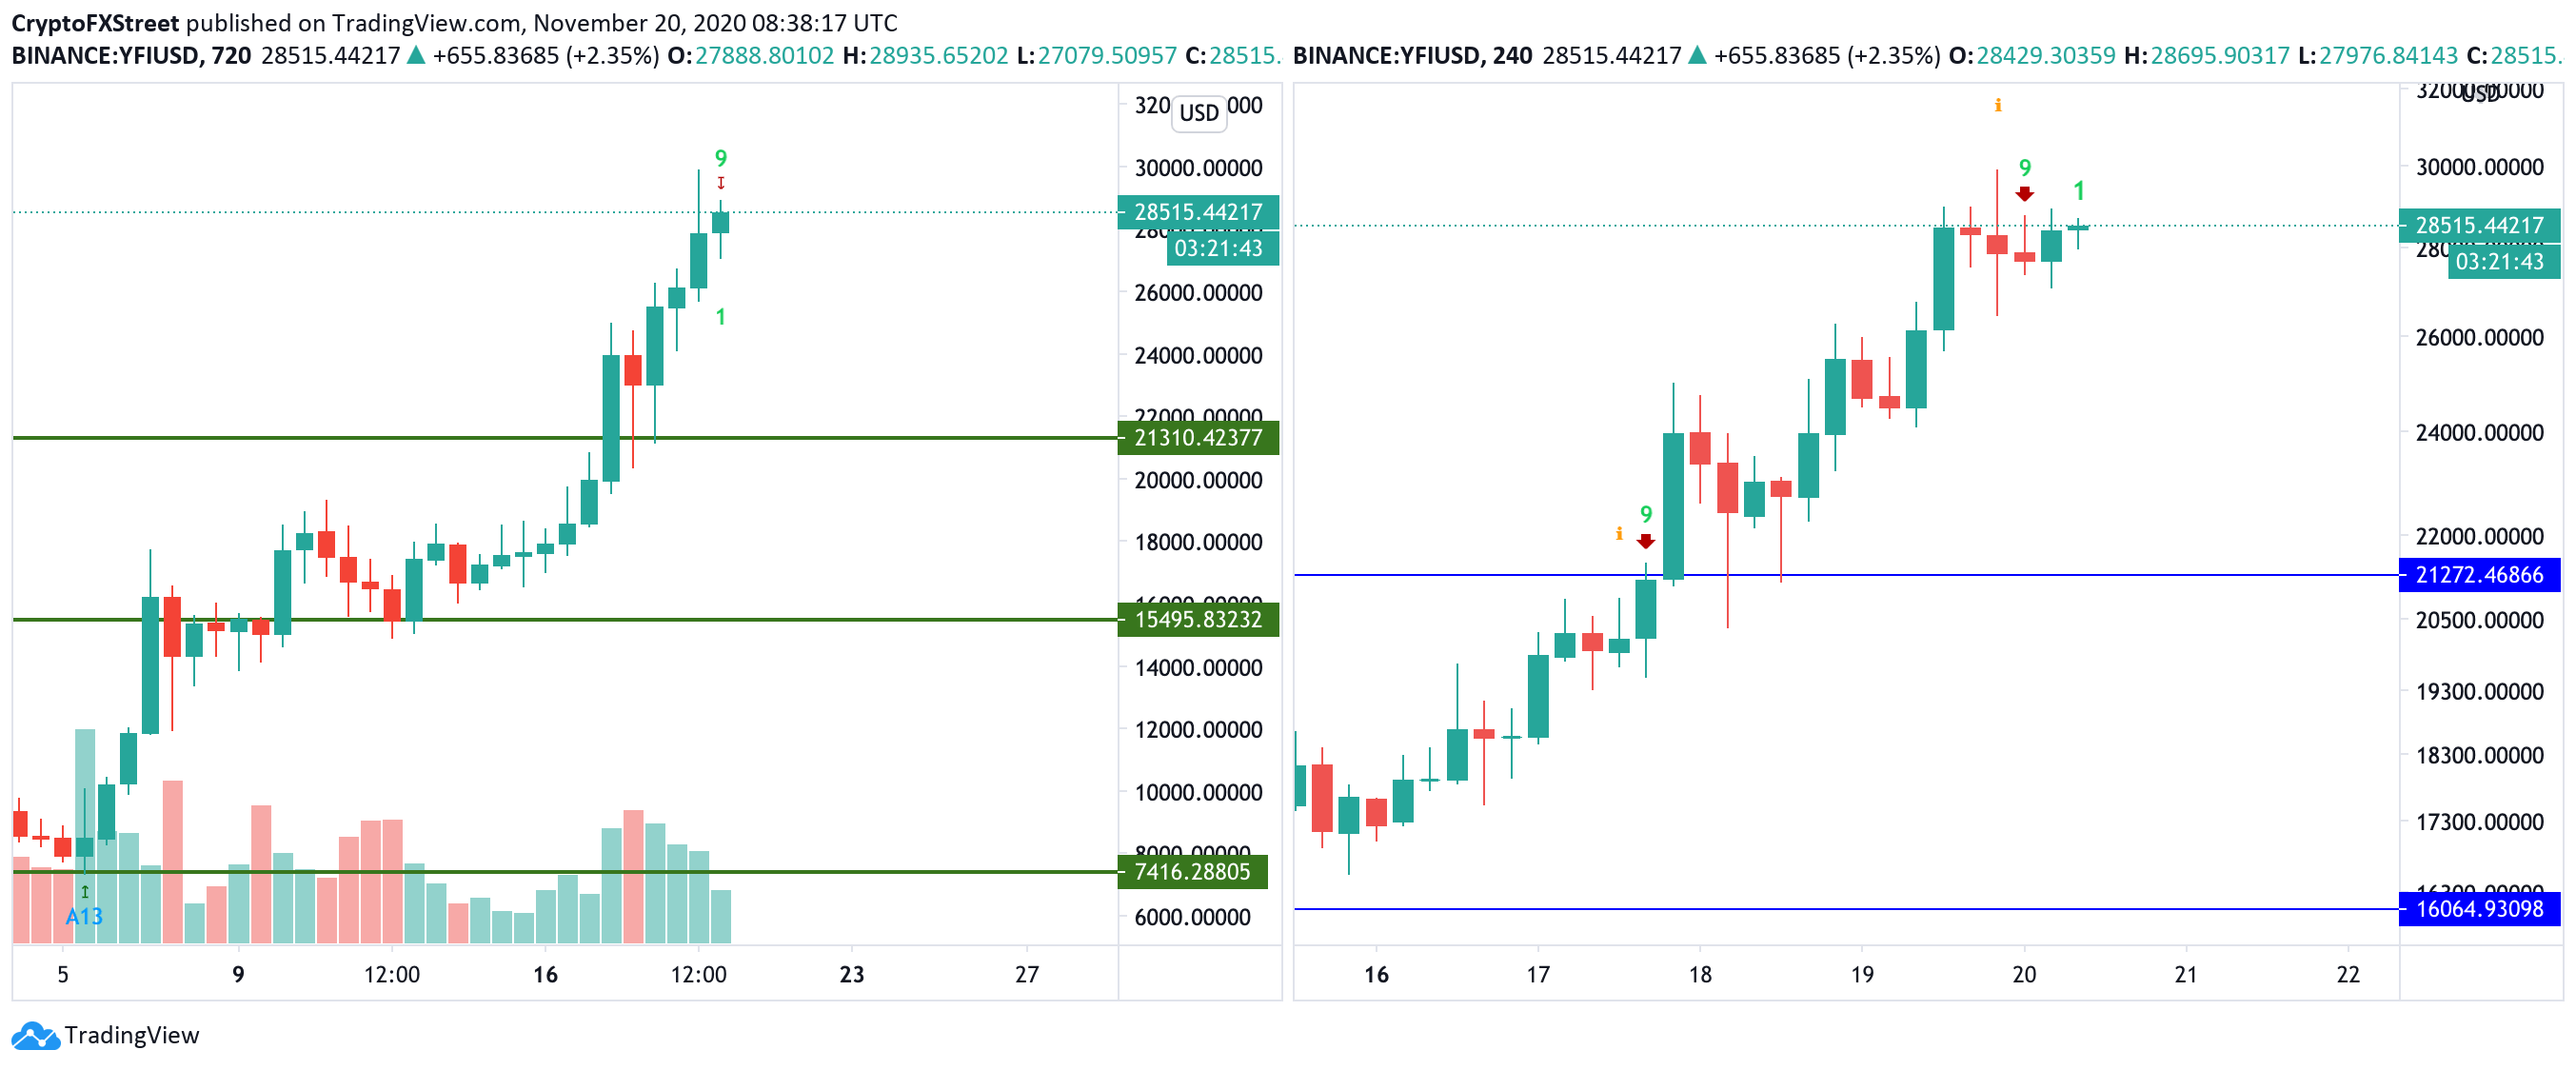
YFI/USD 12-hour and 4-hour charts
YFI price forecast
Looking at YFI supply and demand areas through IntoTheBlock's "In/Out of the Money Around Price" model, we do not find barriers for the bears until $25,000. It means that YFI/USD may reach this area very quickly, but any further sell-off will be limited. Over 320 addresses previously purchased over 290 YFI tokens between $25,000 and $24,000.
If this supply is absorbed, the sell-off may continue towards $21,000 and $20,000.
 20-637414596628606075.png)
YFI In/Out of the Money Around Price
Meanwhile, the way to the north looks like the path of the least resistance, at least until $31,000. This barrier is created by 480 addresses holding 255 YFI. Once it is cleared, the recovery may be extended towards at least $34,300 (September 27 recovery high)
Key levels to watch
YFI/USD is still moving within a bullish trend, but the technical and on-chain indicators show that the correction is underway. The first bearish target is located at $25,000. Once it is out of the way, $21,000 will come into focus.
On the other hand, a sustainable move above $31,000 will invalidate the bearish scenario and bring $34,000 into focus.
Author

Tanya Abrosimova
Independent Analyst