XRP whales are cashing out after 200% breakout
- XRP's rally was triggered by Ripple's push to become a CBDC infrastructure provider.
- The token is grossly overbought and vulnerable to a downside correction.

Ripple's XRP has been on fire recently. The third-largest digital asset's price started gaining ground on November 20 and hit a new multi-year high at $0.7870 on November 24. Despite the subsequent retreat, XRP is still trading 35% higher from this time on Monday. On a week-to-week basis, the token has more than doubled its value.
Notably, Ripple's market value reached $28 billion, while its average daily trading volume catapulted to $30 billion from $6 billion on November 20 before the rally.
Brad Garlinghouse set eyes on CBDC
From a fundamental point of view, XRP owes its growth to a combination of factors, including the report that Ripple has stopped selling XRPs and started buying them instead.
However, Brad Garlinghouse's, CEO of Ripple Labs, comments during a recent podcast interview with The Scoop served as the critical event that started the bullish trend rolling. Ripple's CEO suggested that global central banks could use XRP Ledger to issue state-backed stablecoins. He also noted that XRP was ideal for bridging various currencies.
Obviously, his words match actions as the company posted a job opening for a Senior Director on Central Bank Engagements. He or she will be responsible for partnerships and project work with global central banks with the main focus on central bank digital currency (CBDC) initiatives on XRP Ledger.
In this role, you will define and lead Ripple's strategy with central banks, build relationships with and educate central bankers around the world. The crucial role will also be to secure and manage partnerships with central banks to build and deploy projects.
It is not clear if Ripple's has already been involved in some CBDC developments; however, the company is obviously moving in that direction.
What goes up must come down, and XRP is no different
XRP has been dormant for most of the year and did not participate in the market's rallies. No wonder that this sudden price increase inspired Ripple's bulls and built a wall of optimism about Ripple's future.
However, exaggerated price spikes often result in sharp downside corrections as the market needs to find a new balance before moving further. Now on-chain metrics imply that both speculators and long-term holders are rushing to cash out their coins following the price jump.
 [15.35.21, 24 Nov, 2020]-637418198229998946.png)
XRP's Age Consumed
The Age Consumed metric, calculated by the behavioral analytical company Santiment, spiked on November 24, signaling that a large number of tokens have moved after being idle for a long time. Usually, this points to an impending volatility growth.
While the Age Consumed metric helps to predict sharp market moves, it says nothing about the direction of the price movement.
Traders send XRPs to exchanges
XRP's exchange inflows have increased significantly since Saturday. According to Phillip Gradwell, the chief economist at Chainanalysis, 2.3 billion XRP tokens have been sent to different exchanges, which is a 300% increase over the average daily inflow in the last year.
#xrp price is leading to 2.3 billion XRP being sent to exchanges since Saturday, 3.3x the average daily inflow in the last year, worth nearly $1 billion when sent. That is a lot of sell pressure but demand has been strong so far with median trade intensity twice the average. pic.twitter.com/X0KaweCDJk
— Philip Gradwell (@philip_gradwell) November 24, 2020
Holders usually move their coins to exchanges when they are ready to sell them. Otherwise, they prefer to keep them in the cold wallets. Together with the Age Consumed metric, this data implies that XRP is on the verge of a catastrophic dump.
XRP's price forecast
From a technical point of view, the TD Sequential indicator has printed a sell signal in the form of a green nine candlestick on XRP's 4-hour and 12-hour charts. Increasing selling pressure for XRP may see it drop from one to four daily candlesticks. But if the bearish pressure is strong enough, the token might start a new downward countdown.
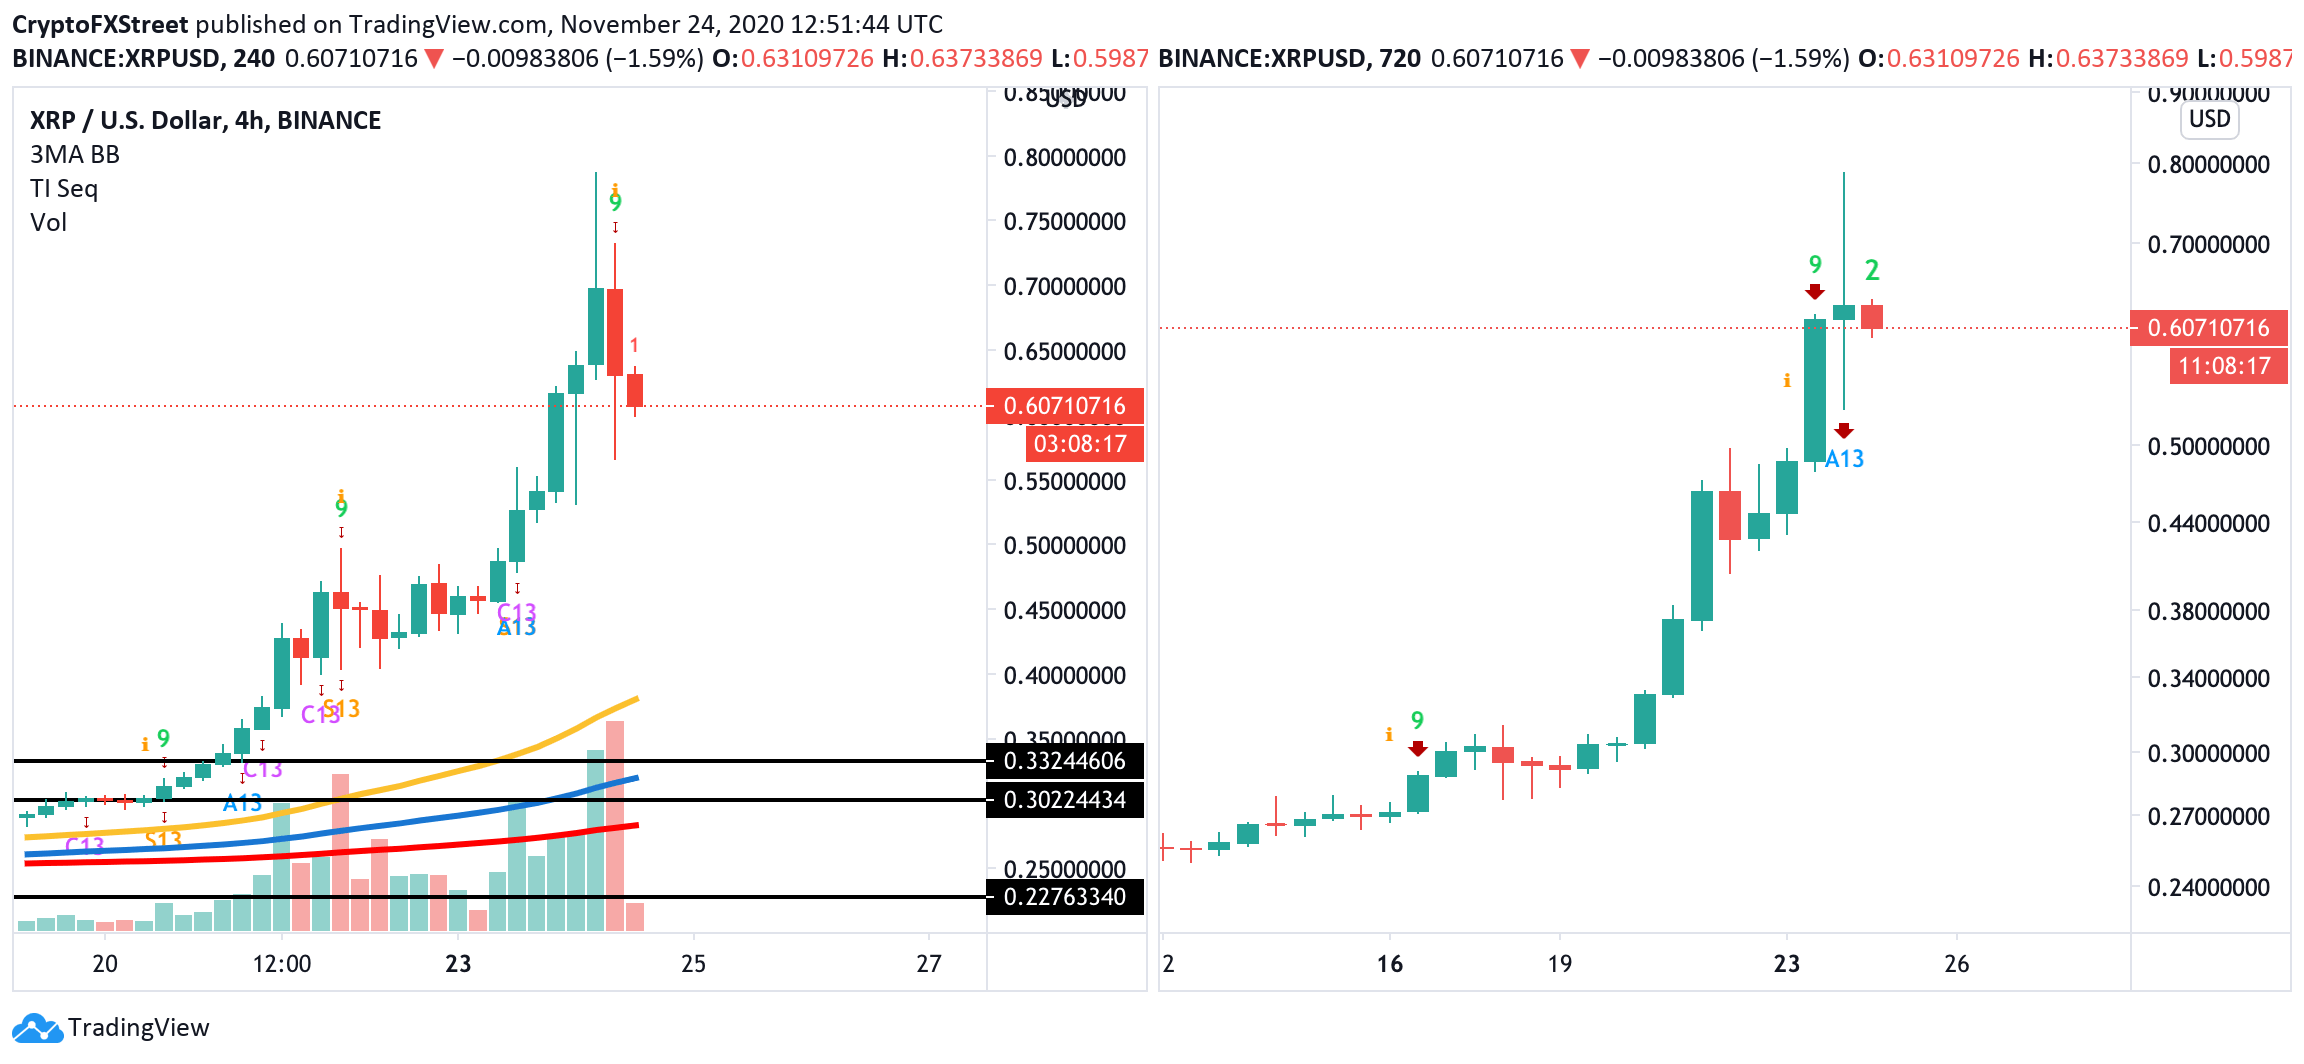
XRP/USD, 4-hour and 12-hour charts
Local support is created by the intraday lows of $0.56 and $0.5. This barrier served as resistance during the recent rally and now can be verified as a support level. Once it is out of the way, 12-hour SMA50 at $0.38 will come into focus. However, the most crucial area comes at $0.3150 as it stopped the recovery in August and slowed down the bulls during November's rally. A sustainable move below this area will invalidate the bullish forecast for XRP.
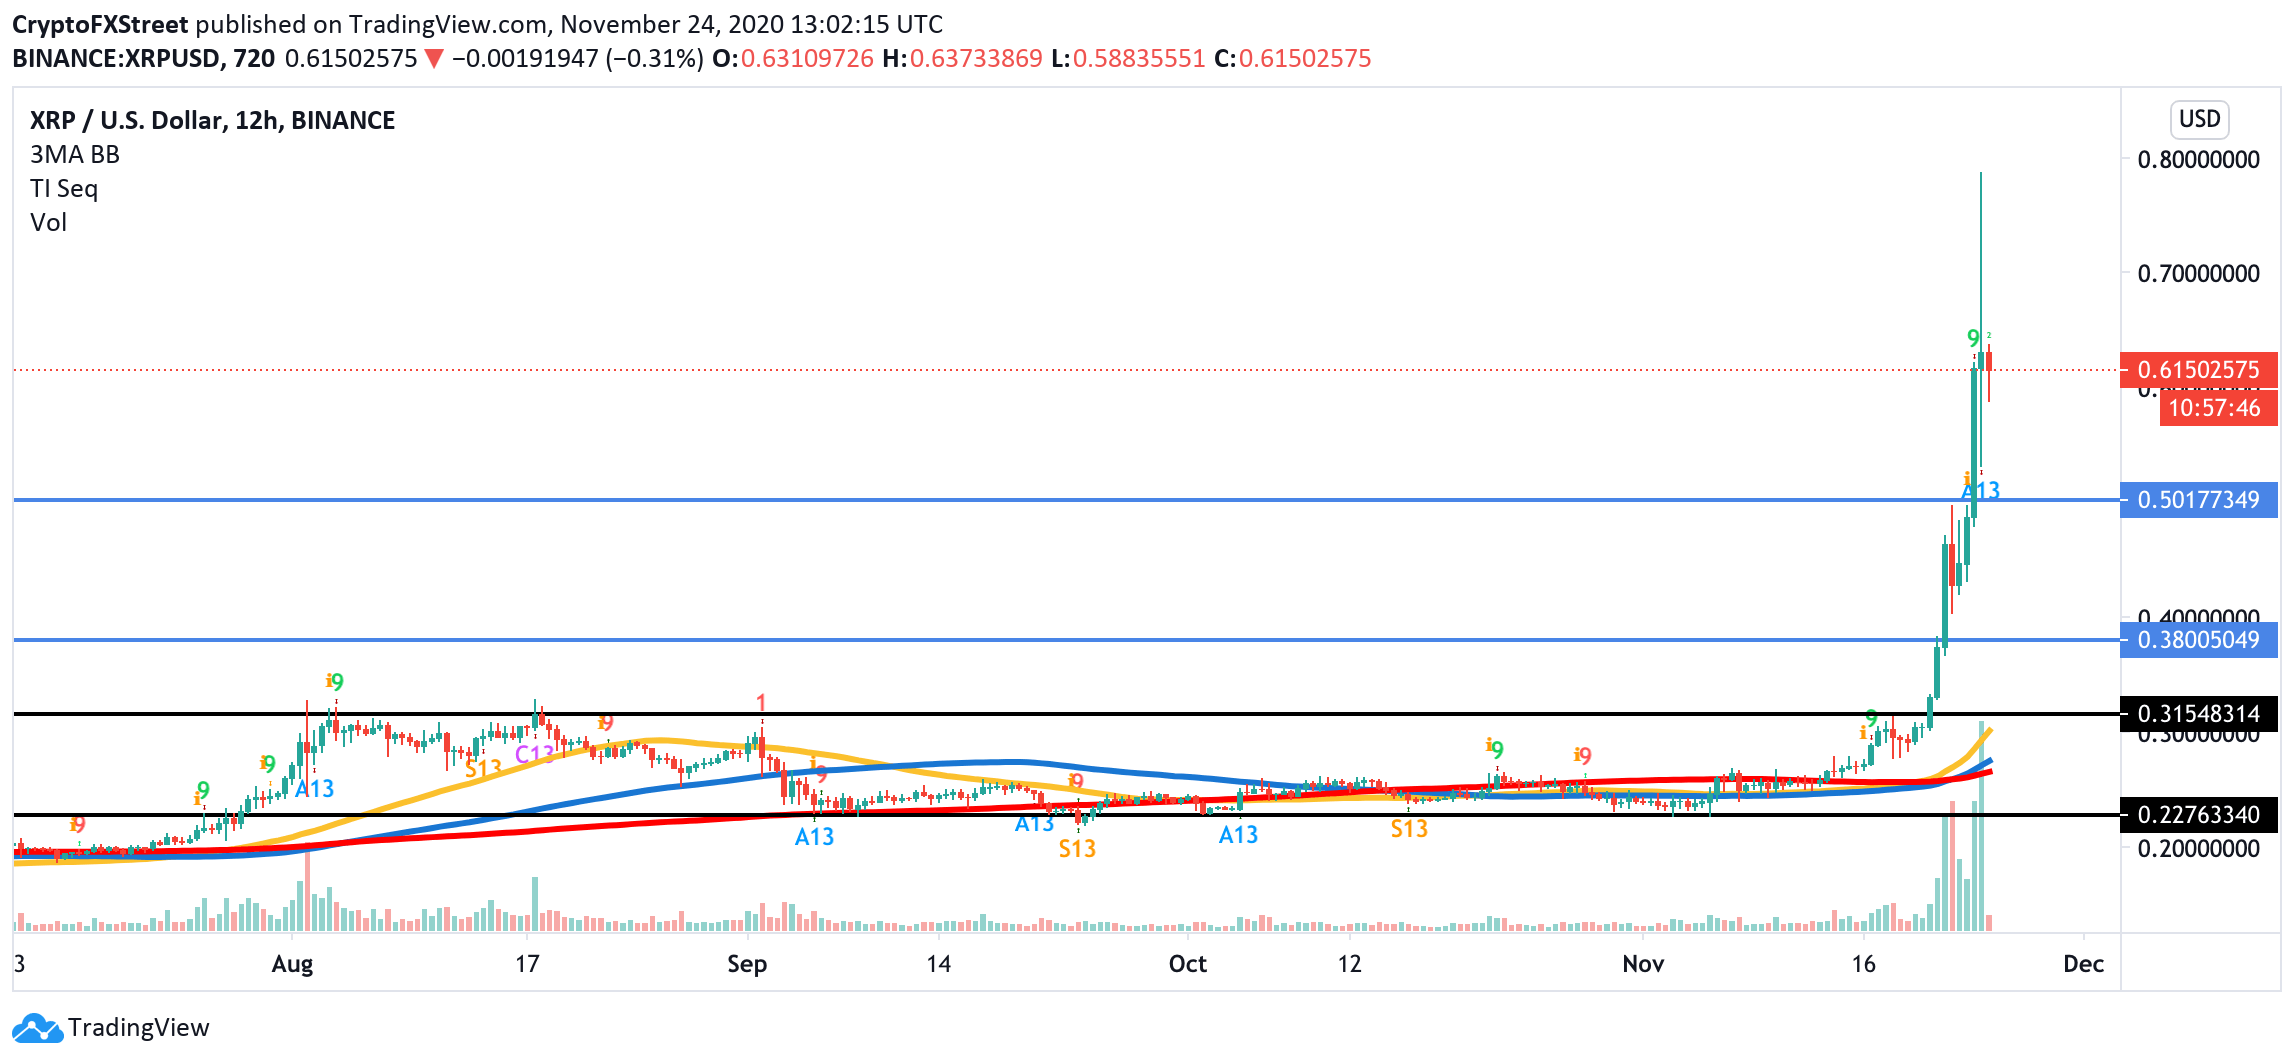
XRP/USD 12-hour chart
On the upside, the first bullish target is $0.70. Above this level, the upside is likely to gain traction, with the next focus on the recent high of $0.78.
Author

Tanya Abrosimova
Independent Analyst


