XRP price risks 40% decline versus Bitcoin despite nine-day ETF inflow streak

XRP (XRP) has fallen about 5% against Bitcoin (BTC) over the past week, and the confirmation of a bearish pattern now points to the risk of more losses ahead.
Key takeaways
- XRP/BTC’s descending triangle pattern on the weekly chart points to a possible 40% drop toward 0.000011 BTC.
- Persistent institutional demand through US-based spot ETFs supports the case for a recovery in XRP price.
XRP’s descending triangle breakdown is underway
Since late 2024, the XRP/BTC ratio has been consolidating inside a descending triangle on the weekly time frame.
In technical analysis, descending triangles are typically viewed as bearish patterns. The pattern was confirmed when the price produced a weekly candlestick close below the triangle’s lower trend line at 0.000096 BTC, as shown in the chart below.
The downside target is derived by taking the height of the triangle and placing it lower from the point where the price breaks below the pattern’s lower trend line.
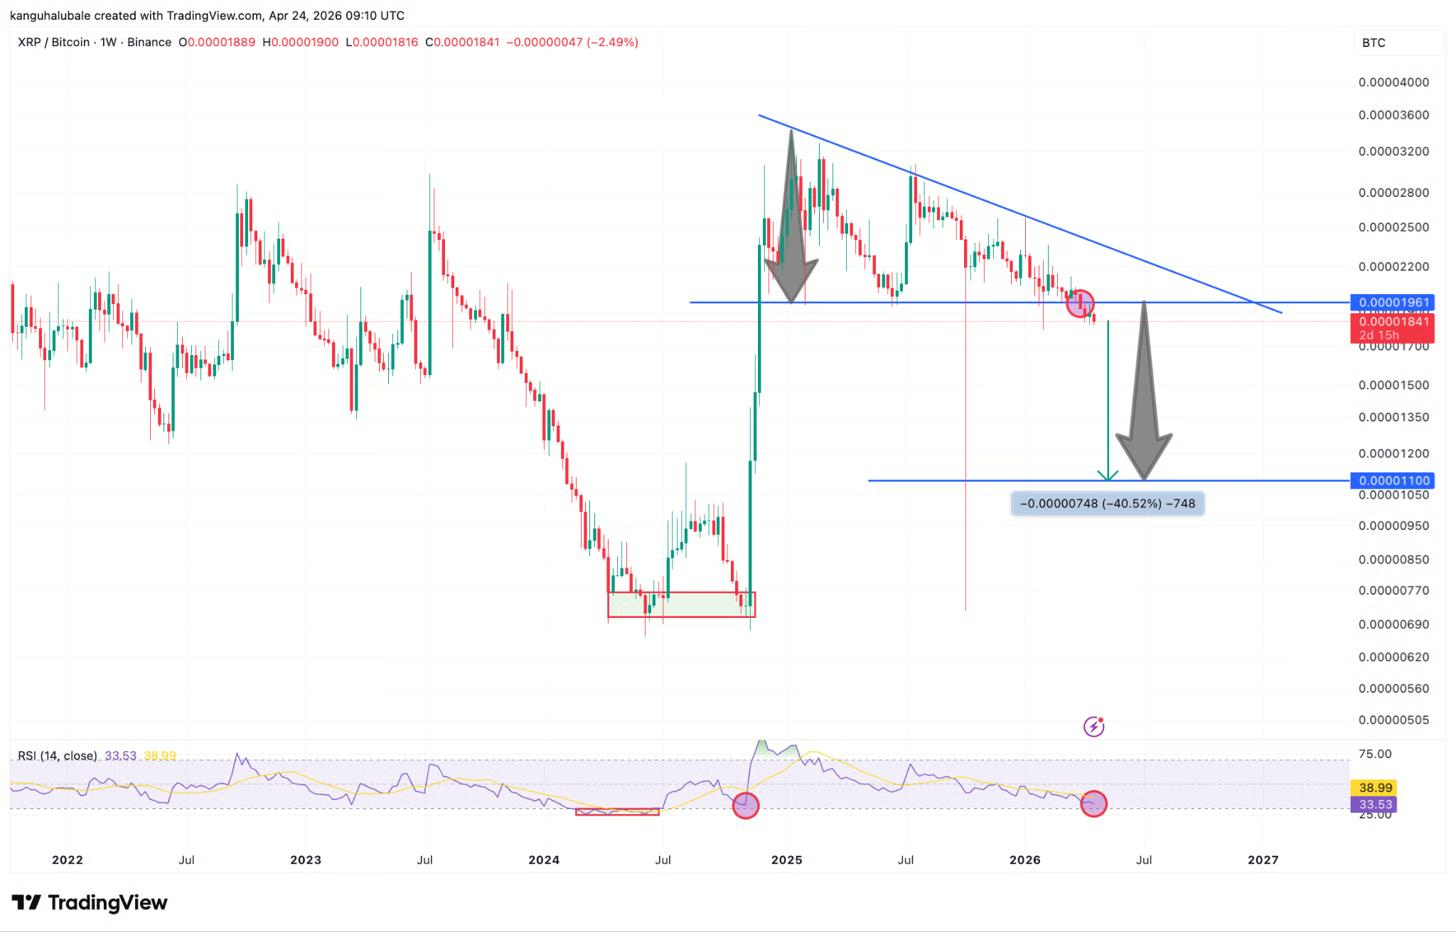
Using that method, the XRP/BTC pair’s measured downside target comes in near 0.000011 BTC, about 40.5% below current levels.
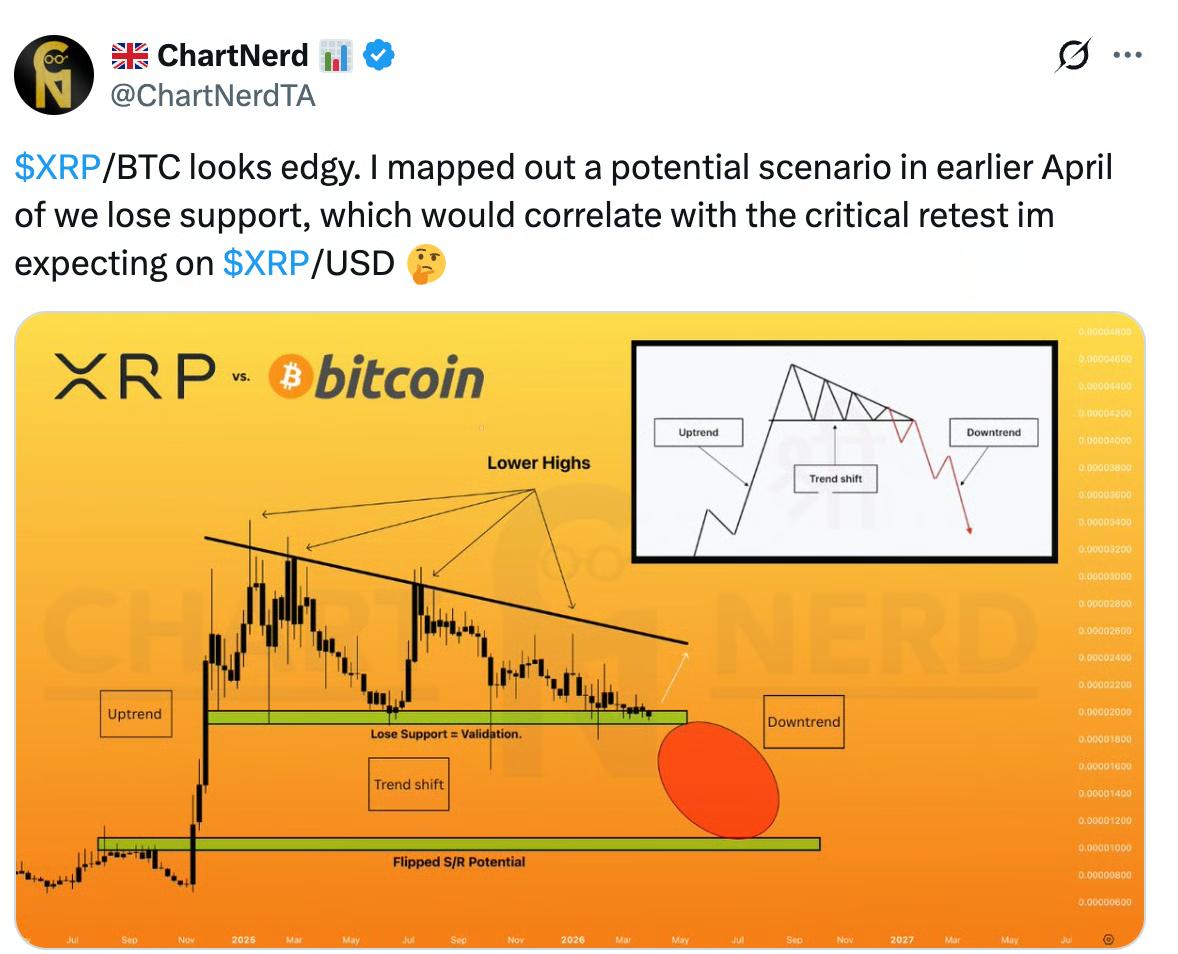
“$XRP/BTC looks edgy,” technical analyst ChartNerd said in a recent post on X, adding that losing support at $0.000091 would lead to further losses in the XRP/BTC ratio as well as the XRP/USD pair.
However, the RSI is near oversold at 33, levels that have previously marked macro bottoms for the ratio, as seen in mid- and late 2024. This suggests that the current downtrend could soon come to an end.
As Cointelegraph reported, a similar recovery could be seen in XRP price as several technical and onchain indicators send bottoming signals.
XRP ETF demand makes a comeback
Institutional demand for XRP investment products has been strengthening, according to data from SoSoValue.
US-based spot XRP exchange-traded funds (ETFs) posted $3.89 million in net inflows on Thursday. This marked nine consecutive days of net inflows, totaling $73.78 million. This streak has pushed cumulative inflows to nearly $1.28 billion and AUM to $1.1 billion.
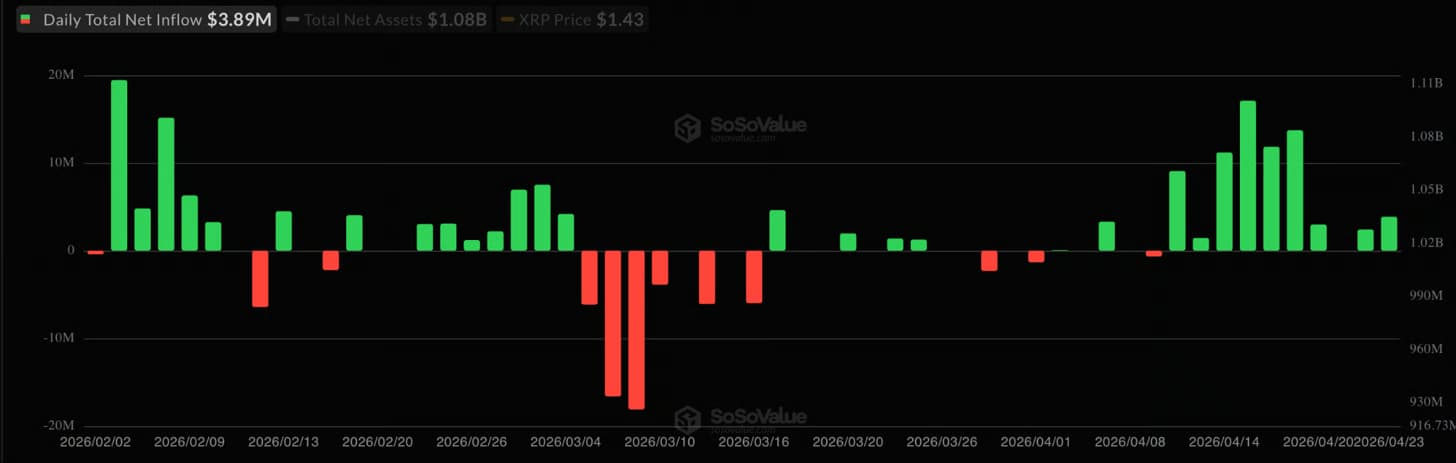
This indicates an increased institutional appetite for XRP products, despite the price declining 22% in 2026 and lagging against Bitcoin.
“$XRP ETF inflows continue,” analyst Don Digital Finance said in a Friday X post.
It signals “steady institutional demand as accumulation continues despite sideways price action,” the analyst added.
“Institutional demand is rising fast as big money continues flowing into XRP exposure,” fellow analyst Ledger Man said, adding:
This could be a major signal that confidence in XRP is growing stronger than ever.
Author

Cointelegraph Team
Cointelegraph
We are privileged enough to work with the best and brightest in Bitcoin.


