Cardano Price Forecast: Fading bearish pressure supports ADA rebound
- Cardano struggles around $0.180 on Monday, after rebounding more than 10% over the previous week.
- Derivatives data show mixed sentiment, indicating uncertainty among traders despite the recent recovery.
- The technical outlook suggests fading bearish strength, hinting at a possible continuation of the recovery.

Cardano (ADA) trades near $0.180 on Monday, pausing after a rebound of more than 10% in the previous week. While the recent recovery has helped ease selling pressure, mixed signals from the derivatives market suggest traders remain cautious about ADA's near-term direction. Meanwhile, technical indicators point to weakening bearish momentum, raising the possibility of further recovery.
Derivatives metrics support mixed signals
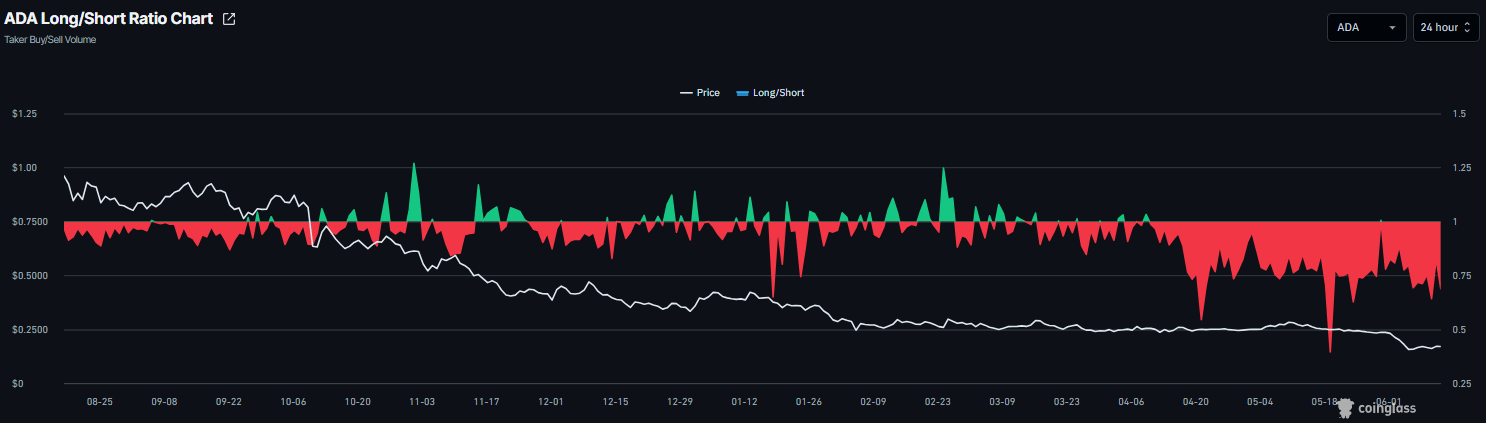
On the derivatives side, Cardano data show mixed sentiment. CoinGlass’ long-to-short ratio for ADA reads 0.81 on Monday, nearing its lowest level in over a month. This ratio, being below one, reflects bearish sentiment in the market, as more traders are betting on the asset’s price to fall.
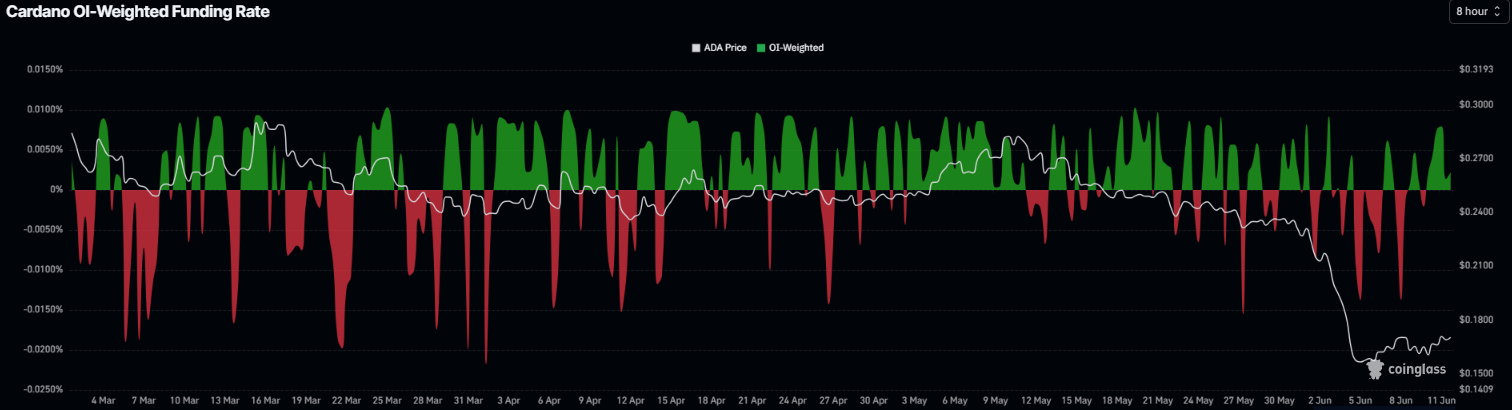
However, the funding rates data show improving sentiment. CoinGlass’ OI-Weighted Funding Rate data for ADA flipped positive, reading 0.0083%, on Monday. This positive rate indicates that longs are paying shorts and projecting a bullish sentiment.
The above-mentioned combination suggests indecision among Cardano investors and a lack of clear directional bias.
Some signs of optimism
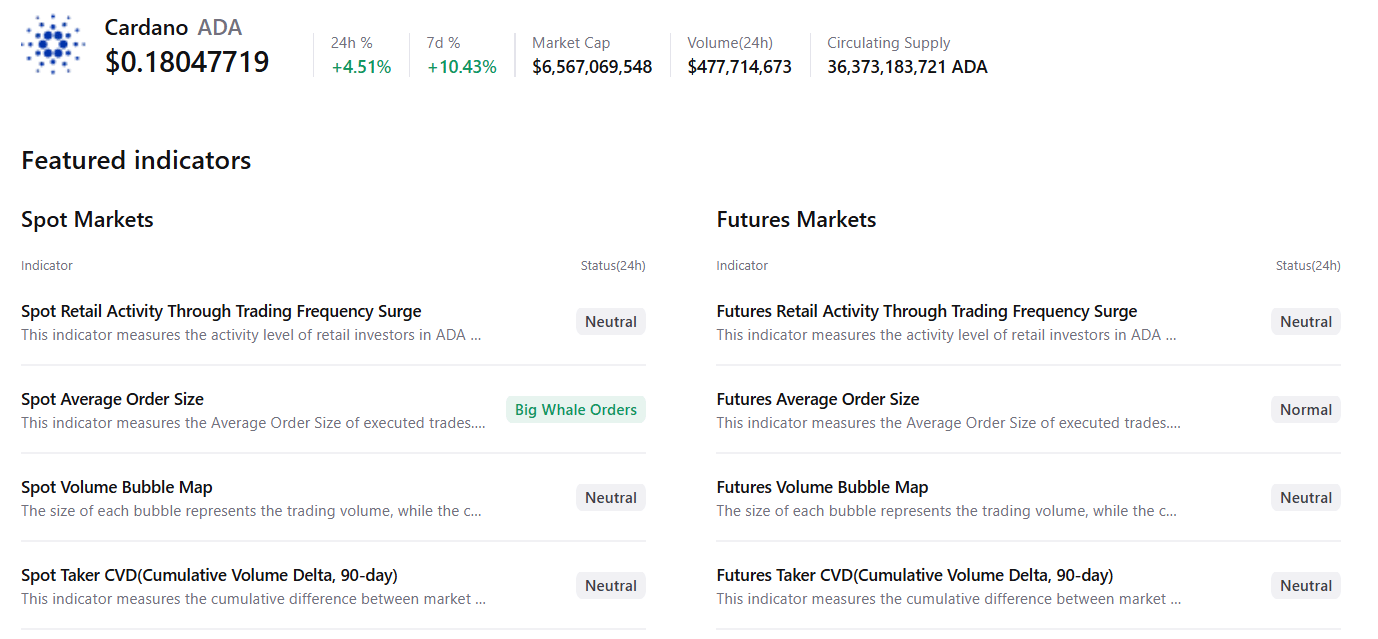
CryptoQuant’s summary data show some signs of optimism. Cardano’s spot markets show large-whale orders amid neutral conditions across other metrics, supporting a potential recovery.
Cardano Price Forecast: Momentum indicators show fading bearish strength
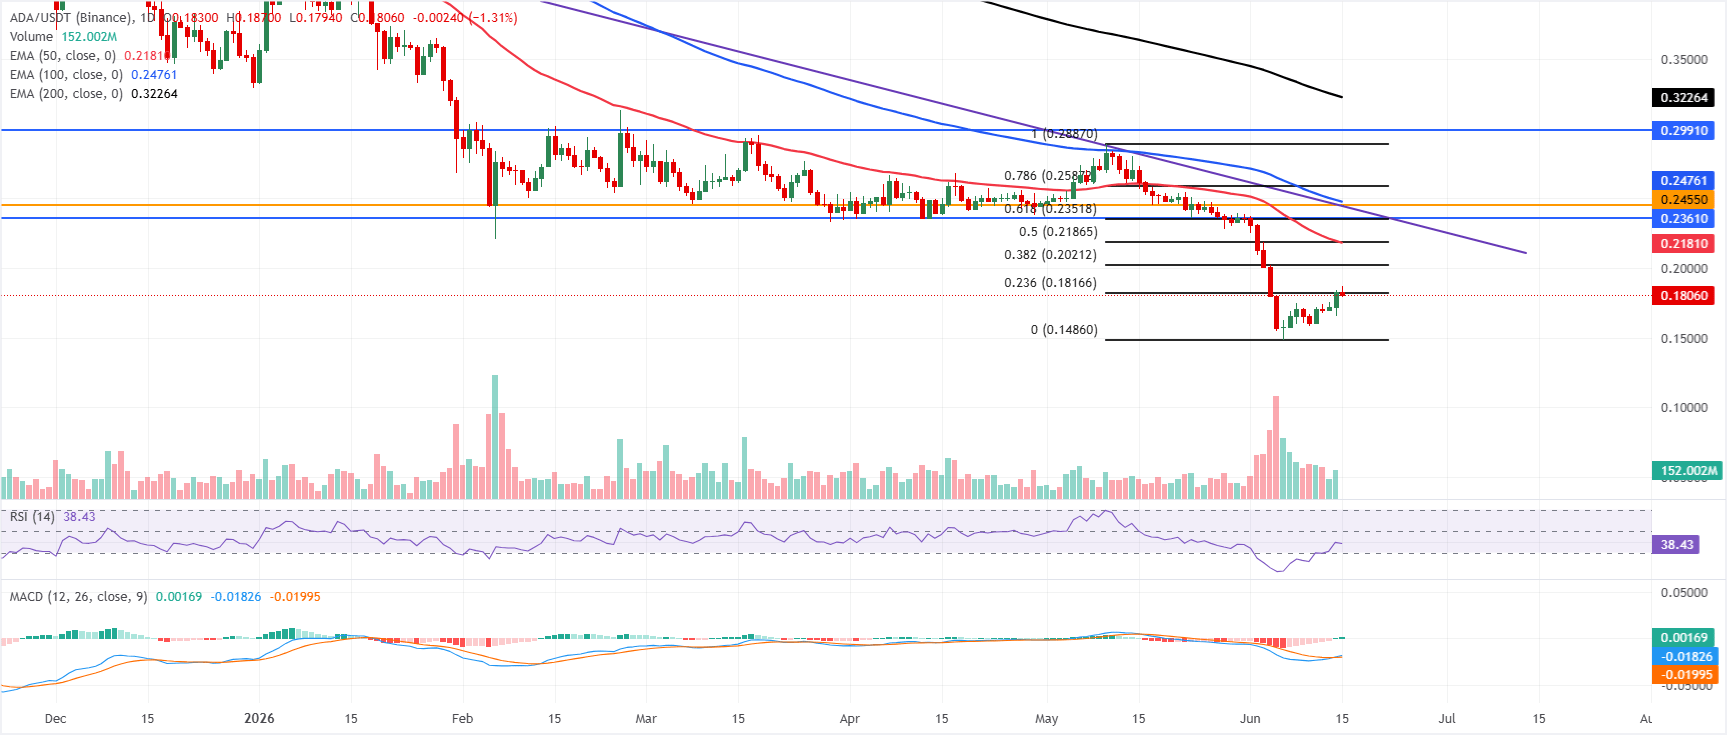
Cardano trades at $0.180 on Monday after a rebound of over 10% in the previous week. However, ADA is reinforcing a bearish near-term bias as it holds well below the 50-day, 100-day, and 200-day Exponential Moving Averages (EMAs) at roughly $0.218, $0.247, and $0.322. The pair has retraced deeply toward the lower end of the recent Fibonacci swing, with only the 0.0% retracement acting as structural support near $0.148. At the same time, momentum remains fragile as the Relative Strength Index (RSI) on the daily chart hovers around 38, even as the Moving Average Convergence Divergence (MACD) turns slightly positive, hinting at a modest pause rather than a sustained recovery for now.
On the topside, initial resistance emerges at the 23.6% Fibonacci retracement at $0.181, with further hurdles at the 38.2% Fibonacci retracement level near $0.202 and the 50% retracement and 50-day EMA clustered around $0.218 and $0.218.
Above that, a dense supply zone aligns between the 61.8% Fibonacci retracement at $0.235, the horizontal barriers at $0.236 and $0.245, the broken trendline area around $0.244 and the 100-day EMA at $0.247, before higher resistances at $0.258, $0.288, $0.299 and the 200-day EMA near $0.322; on the downside, the Fibonacci anchor at $0.148 forms the next major support if selling pressure resumes.
(The technical analysis of this story was written with the help of an AI tool.)
Author

Manish Chhetri
FXStreet
Manish Chhetri is a crypto specialist with over four years of experience in the cryptocurrency industry.



