XRP Price Prediction: Ripple needs to crack $1.1950 to unleash additional recovery
- A falling wedge breakout confirmed on Ripple’s 4H chart.
- Critical 50-SMA resistance at $1.1950 caps the rebound in XRP price.
- RSI has turned south but holds above 50.00, keeping bulls hopeful.

The rebound in the XRP price from nine-day lows of $1.0543 loses traction just shy of the $1.20 mark, as sellers regain control early Saturday.
Ripple price has been on a downtrend after failing to sustain above the $1.30 threshold earlier this week. Although Friday’s impressive bounce has revived optimism for the bullish traders.
On the fundamental front, there is encouraging news lately, with Ripple announcing a new development, which could drive XRP Ledger (XRPL) to challenge ETH and BSC in the smart contract arena.
Let’s see how XRP price is positioned on the technical graph
XRP price has stalled its renewed upswing, as it runs into fresh offers at the horizontal 50-Simple Moving Average (SMA) on the four-hour chart at $1.1950.
Despite the latest downtick, XRP’s technical picture remains upbeat, especially in light of a falling wedge breakout validated on a sustained break above the falling trendline resistance at $1.1201 in Europe last session.
The upside breakout prompts XRP bulls to take out the key 21-SMA and 100-SMA, then at $1.1482 and $1.1629 respectively.
The Relative Strength Index (RSI) has turned south, collaborating with the retracement in XRP price. The leading indicator is currently trading at 54.04, keeping the bullish traders hopeful.
Therefore, its imperative for XRP price to defend the 100-SMA, now at $1.1658, to keep the recovery momentum intact from multi-day troughs.
A failure to hold onto the latter could bring the 21-DMA resistance-turned-support, now at $1.1342, back in play.
Further south, the wedge resistance now support at $1.0977 could test the bearish commitments.
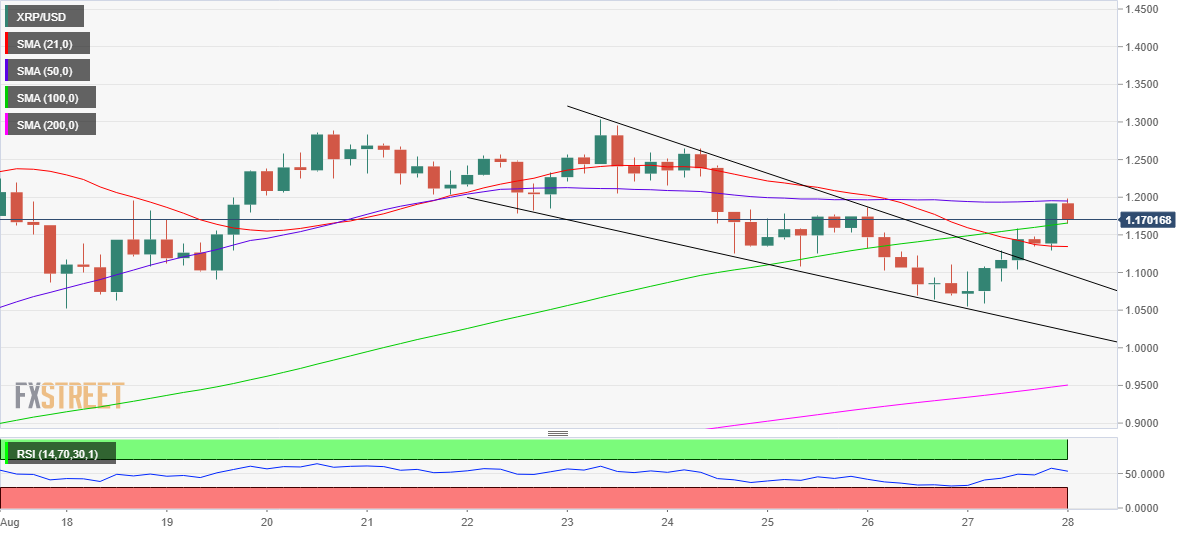
XRP/USD: Four-hour chart
Alternatively, a four-hourly candlestick closing above the 50-SMA will revive the uptrend towards $1.30, where the August 23 high merges.
The next powerful upside barrier aligns at the August 15 high of $1.3494.
If the bullish momentum gathers strength, then a test of the pattern target measured at $1.3697 remains inevitable.
Author

Dhwani Mehta
FXStreet
Residing in Mumbai (India), Dhwani is a Senior Analyst and Manager of the Asian session at FXStreet. She has over 10 years of experience in analyzing and covering the global financial markets, with specialization in Forex and commodities markets.


