XRP at a crossroads: Hold at $2.76 will define the next leg in the five-month channel

XRP/USD has retraced to the 50% level and annual VAH at $2.76 within its 5-month bullish channel—secure that pivot to target $2.92, $3.27, and $3.63, but a break risks a deeper slide toward $2.21 and the channel floor at $1.85.
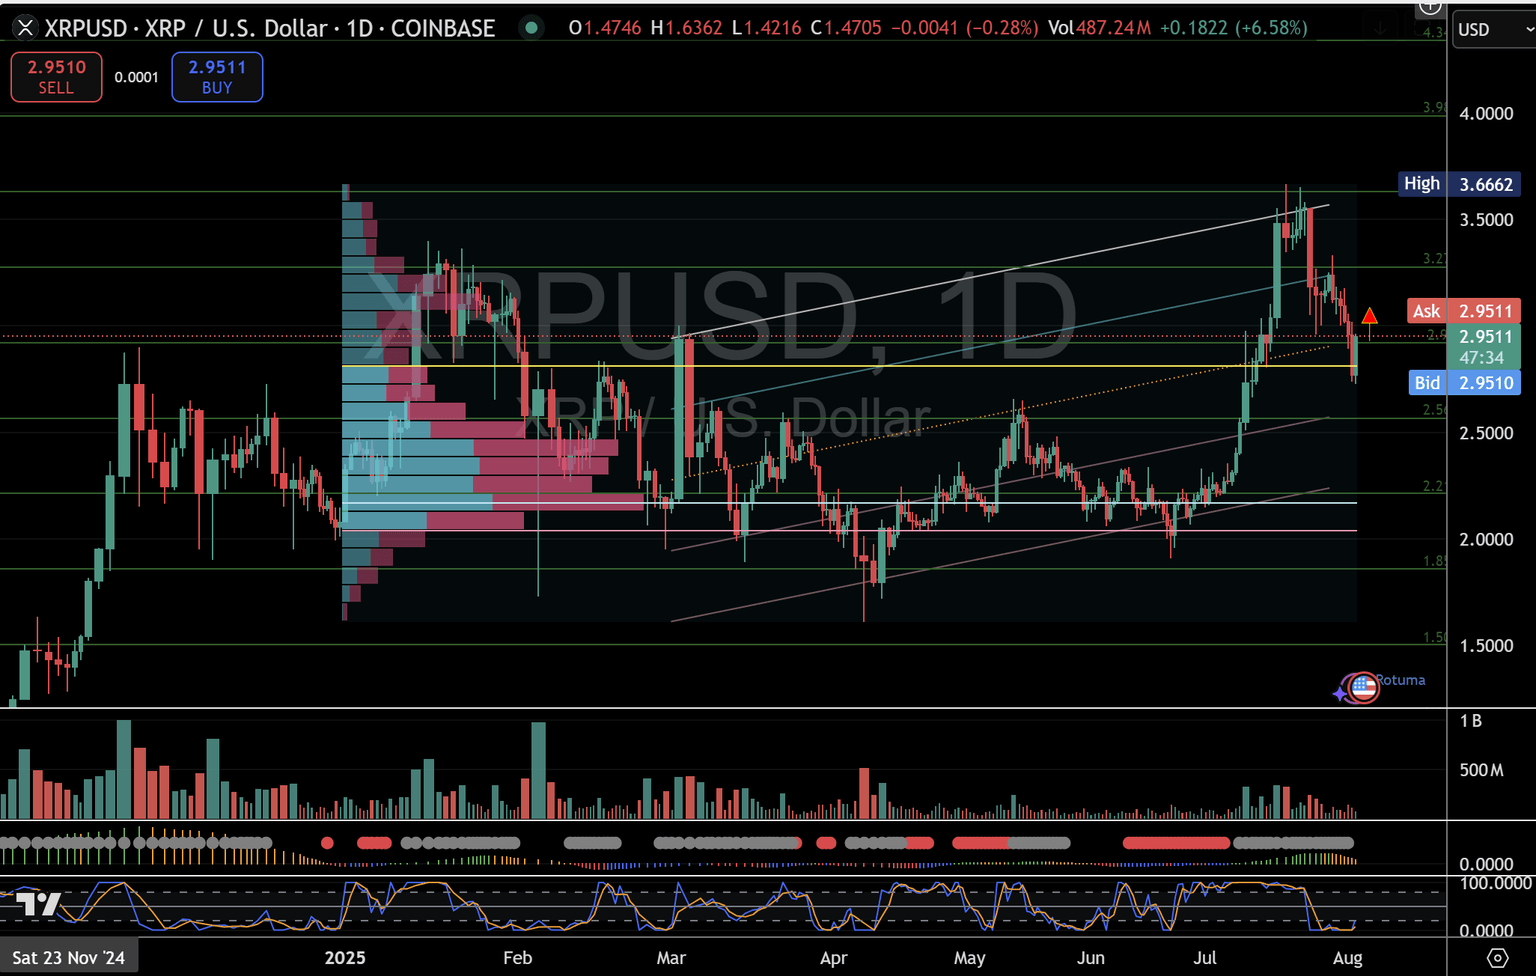
Over the past five months, XRP has traded inside a rising parallel channel, rhythmically advancing from lows near $1.85 to highs around $3.63. In August, price pulled back roughly 50% of that move, finding confluence at the $2.76 level—also the annual value area high (VAH) on the volume profile.
- Volume profile insight:
- The VAH at $2.76 aligns with the 50% Fibonacci retracement, making it a key battleground between buyers and sellers.
- Above current levels, there’s light volume from $2.92 to $3.27, suggesting swift moves if that zone is reclaimed.
- Channel context & momentum:
- Price sits at the mid-section (median line) of the bullish channel. A successful bounce here typically leads to a run toward the channel’s upper boundary.
- TTM Squeeze momentum bars have compressed, indicating a coiling phase—watch for expansion to signal direction.
- The daily stochastic has turned up from oversold territory, hinting at a potential relief rally.
Crucial levels to watch
- Key pivot – $2.76
- Hold & bounce: Validates mid-channel support, opens door for $2.92 (channel median), then $3.27 and $3.63.
- Break below: Confirms deeper correction, targets initial support at $2.56.
- First support – $2.56
- Previous congestion zone and lower volume node; a typical stopping point in a moderate retracement.
- Secondary support band – $2.21–$2.12
- Near the channel’s lower parallel, a normal pullback could bottom here before bulls re-enter.
- Channel floor – $1.85
- Breach shifts medium-term bias bearish, risking a fall toward the 2025 range low at $1.50.
What lies ahead
- Bullish scenario:
- A decisive daily close above $2.76, coupled with rising volume, would confirm support—and likely trigger a fast move through $2.92 toward $3.27 and the channel top at $3.63.
- Bearish scenario:
- Failure to defend $2.76 could see stops cascade into $2.56, with the real test at $2.21–$2.12. A break below $1.85 would flip the outlook negative and invite lower lows.
Traders should monitor volume spikes at the major levels and watch for momentum shifts to gauge breakout or breakdown risk.
Author

Denis Joeli Fatiaki
Independent Analyst
Denis Joeli Fatiaki possesses over a decade of extensive experience as a multi-asset trader and Market Strategist.


