XRP and XLM outlook: Mixed sentiment cloud direction
- Ripple price nears key resistance at $1.40 on Tuesday, a firm close above suggests gains ahead.
- Stellar price steadies at $0.158, signaling consolidation after recent correction.
- On-chain and derivatives data for both XRP and XLM reflect mixed sentiment and lack a clear directional bias.

Ripple (XRP) and Stellar (XLM) remain under pressure on Tuesday as mixed market sentiment keeps price action subdued. XRP approaches a key resistance at $1.40, while XLM stabilizes near $0.158, amid mixed signals from on-chain activity and derivatives positioning that point to a lack of clear directional bias across both altcoins.
On-chain activity shows mild bullish signs
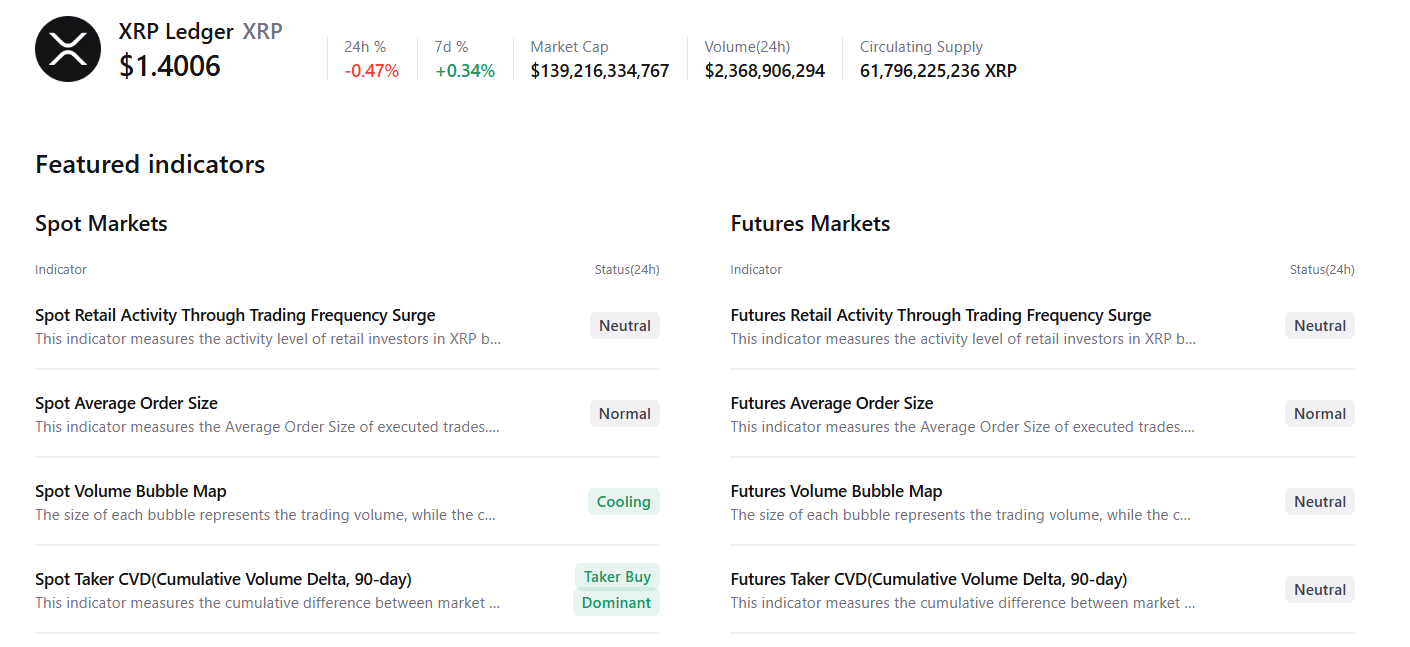
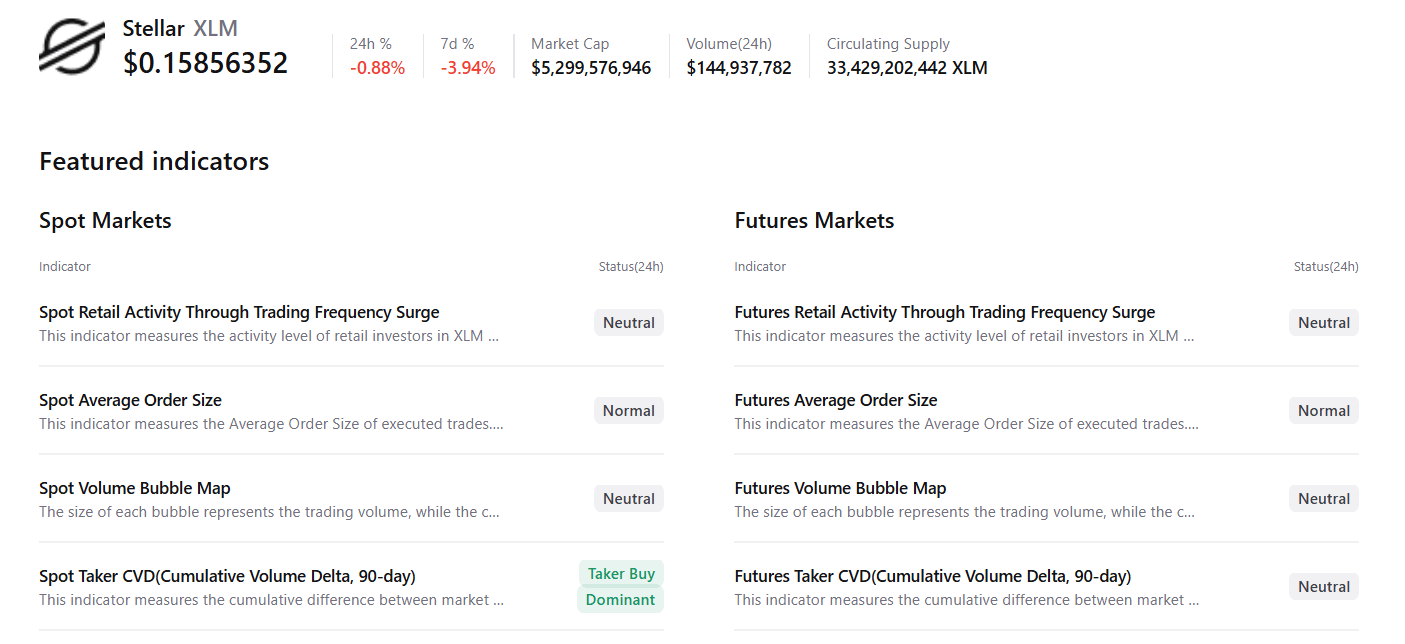
CryptoQuant summary data suggests a neutral to slightly bullish outlook for XRP and XLM.
XRP’s spot markets show cooling conditions and buy-side dominance, with mostly neutral conditions across other metrics, suggesting a potential upside move.
Meanwhile, for XLM, the data shows buy-side dominance with largely neutral conditions across other metrics, suggesting mild bullish signs.
Derivatives data lacks a clear directional bias
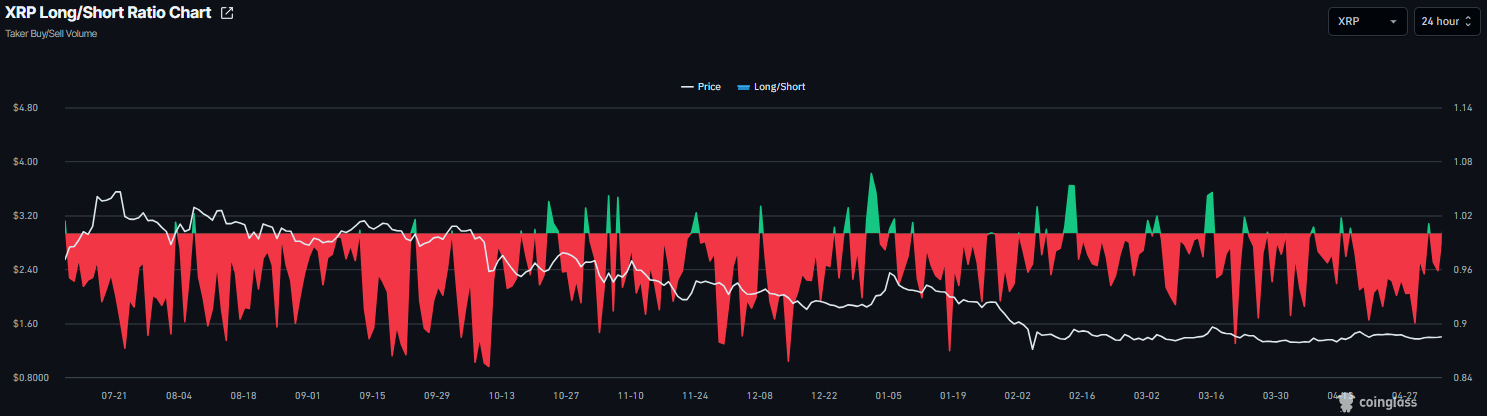
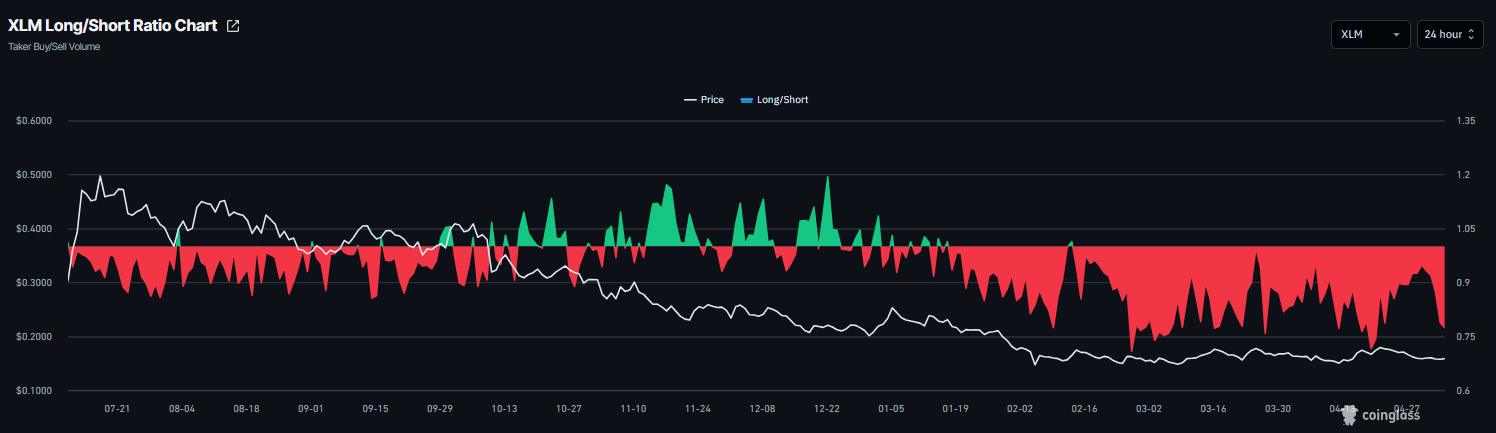
On the derivatives side, Ripple and Stellar data show mixed sentiment. CoinGlass’ long-to-short ratio for XRP and XLM reads 0.95 and 0.77, respectively, on Tuesday. This ratio, being below one, reflects bearish sentiment in the market, as more traders are betting on the asset’s price to fall.
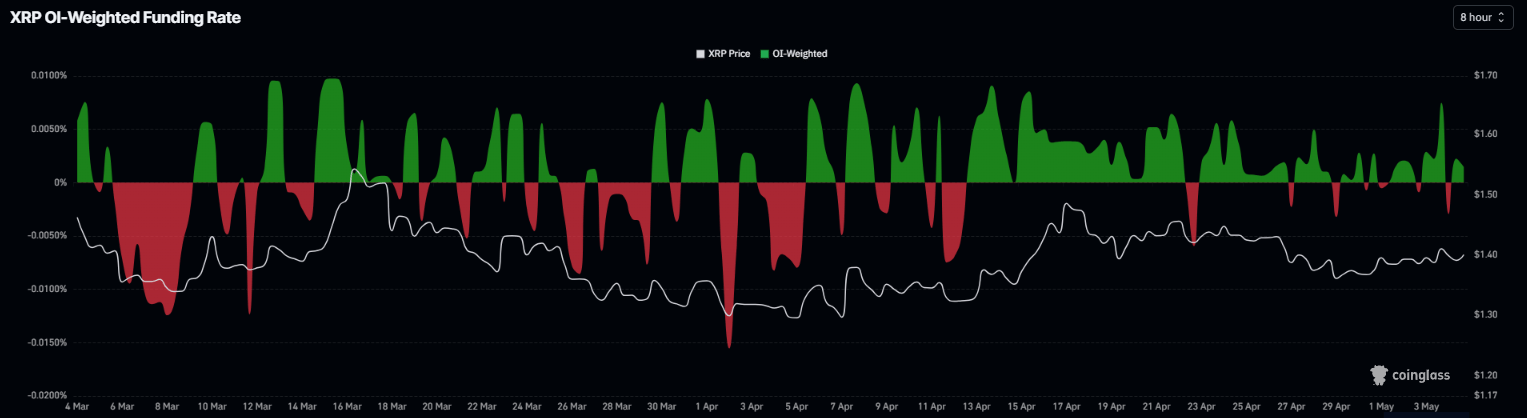
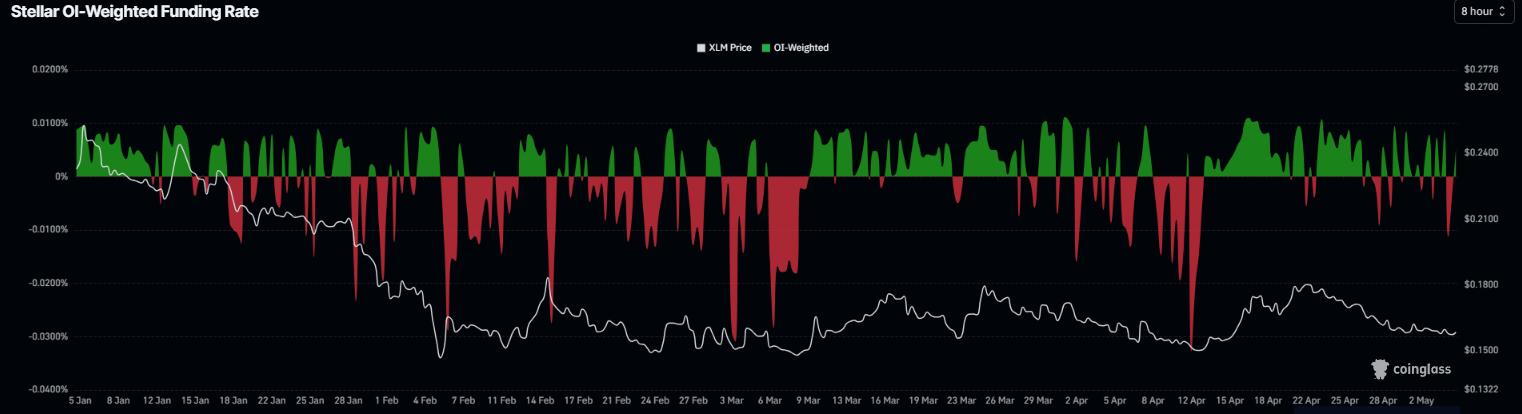
However, the funding rates data for both altcoins support improving sentiment. CoinGlass’ OI-Weighted Funding Rate data for XRP and XLM flipped positive on Tuesday, reading 0.0015% and 0.0052%, respectively. This positive rate indicates that longs are paying shorts and projecting a bullish sentiment.
The above-mentioned combination suggests indecision among XRP and Stellar investors and a lack of clear directional bias.
XRP technical outlook: Near key resistance zone
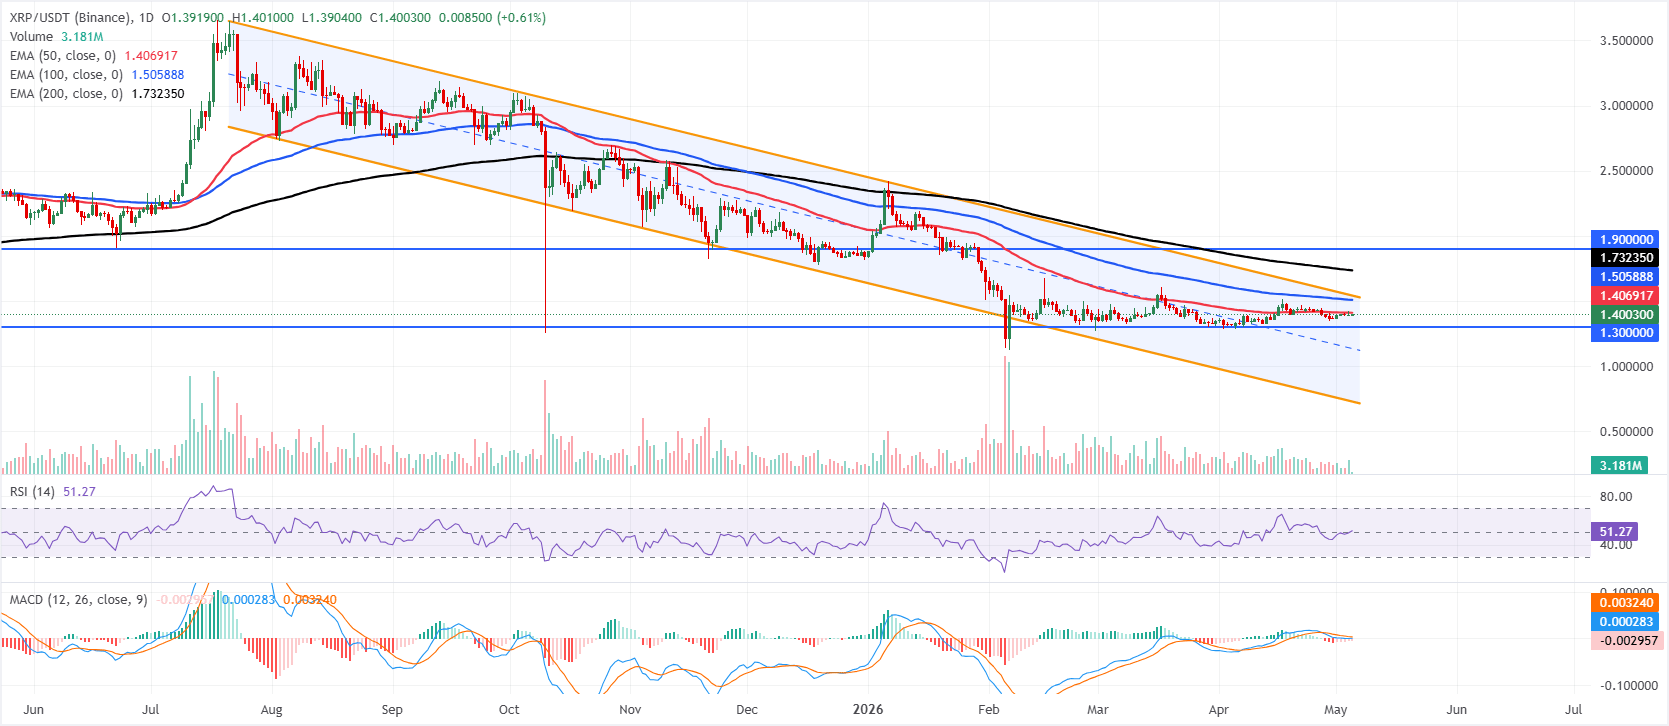
XRP is trading at $1.40 on Tuesday, holding a capped bias as it remains below the key Exponential Moving Averages (EMAs). Price is currently trading below the 50-day EMA at $1.40, with the 100-day EMA at $1.50 and the 200-day EMA at $1.73 reinforcing a layered topside barrier within a broader downward parallel channel whose upper boundary is near $1.53.
Momentum is mixed, with the Relative Strength Index (RSI) on the daily chart hovering just above the 50 mark while the Moving Average Convergence Divergence (MACD) remains marginally negative, hinting that recovery attempts lack decisive follow-through for now.
On the upside, immediate resistance is located at the 50-day EMA around $1.40, followed by the 100-day EMA near $1.50 and the channel top at $1.53; above these, the 200-day EMA at $1.73 and the horizontal barrier at $1.90 define a broader supply zone.
On the downside, initial support is seen at the horizontal level of $1.30, while a clearer bearish extension could expose the lower boundary of the descending channel near $0.72.
Stellar technical outlook: Consolidates after recent correction
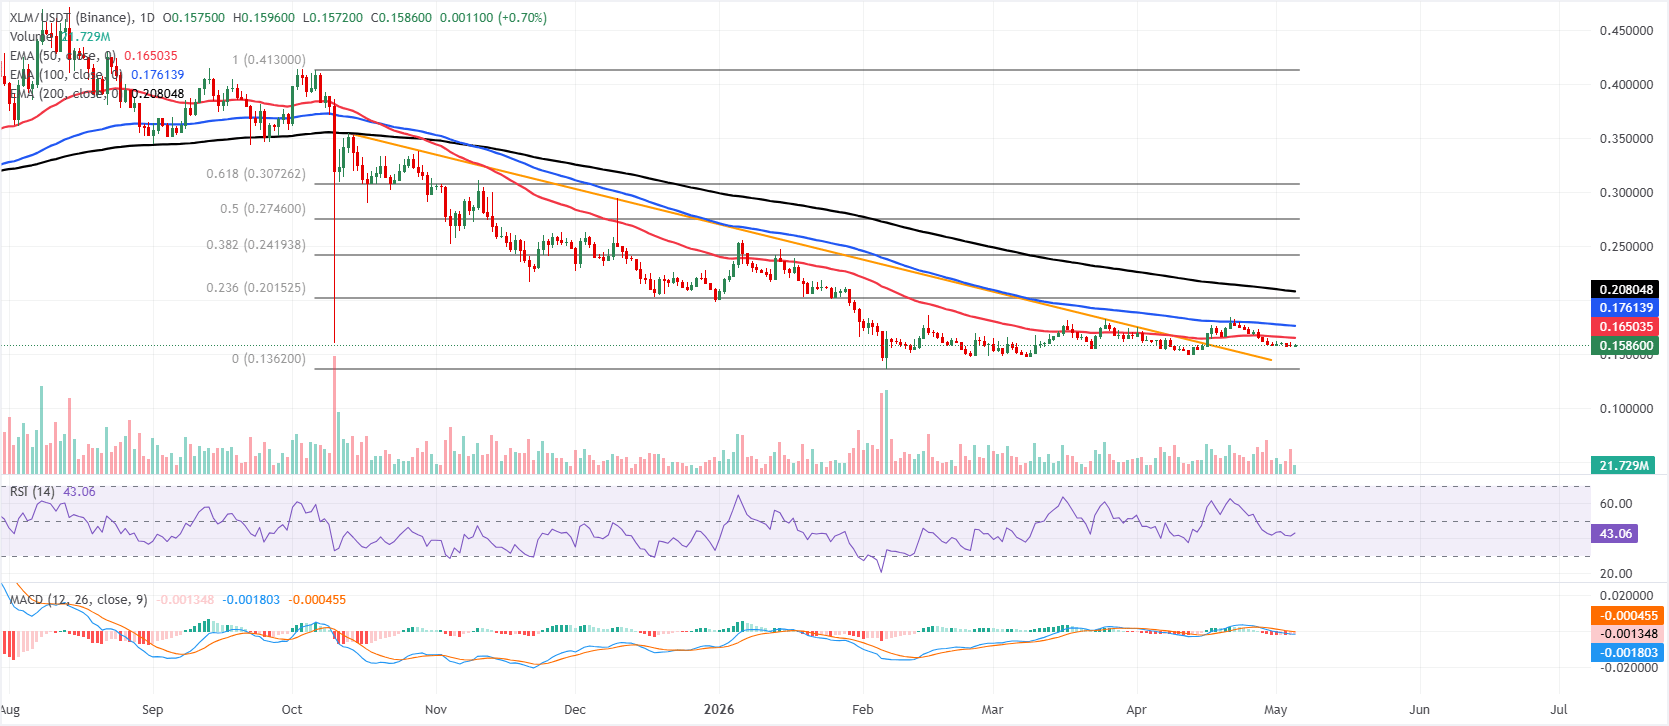
XLM trades at $0.158 on Tuesday, maintaining a bearish near-term bias as it holds beneath the key EMAs. The 50-day EMA at roughly $0.165, the 100-day EMA near $0.176 and the 200-day EMA around $0.208 all sit overhead as layered resistance, suggesting rallies are likely to be capped while the pair remains below this stack.
The RSI on the daily chart hovers around 43, suggesting subdued demand, while the MACD remains in negative territory, indicating that downside momentum persists despite recent stabilization.
On the topside, initial resistance is seen at the 50-day EMA around $0.165, followed by the 100-day EMA near $0.176. Above there, the 23.6% Fibonacci retracement of the broader downswing lines up around $0.201, ahead of the 200-day EMA close to $0.208, forming a broader supply zone.
On the downside, immediate focus sits on the nearby intraday pivot around the current price, with stronger support emerging toward the prior trendline break area near $0.139 and the Fibonacci anchor around $0.136; a break under this band would expose the pair to a deeper retracement of the prior advance.
(The technical analysis of this story was written with the help of an AI tool.)
Author

Manish Chhetri
FXStreet
Manish Chhetri is a crypto specialist with over four years of experience in the cryptocurrency industry.



