Worldcoin integrates Chainlink CCIP as WLD eyes rebound, LINK faces supply pressure
- Worldcoin’s WLD token unlocks cross-chain functionality with Chainlink’s CCIP.
- Chainlink expands its LINK reserve to 371,019 tokens with a purchase of 47,903.09 tokens on Thursday.
- WLD prepares to rebound while LINK struggles to absorb incoming supply pressure.

Worldcoin (WLD) announced the adoption of Chainlink’s (LINK) Cross-Chain Interoperability Protocol (CCIP) to enable cross-chain transfers, while WLD's technical outlook suggests a potential rebound with a wedge pattern breakout.
Meanwhile, Chainlink bought back LINK tokens on Thursday to further expand its token reserve. Despite this, LINK struggles to regain traders’ interest and risks further decline.
Worldcoin eyes wedge breakout amid Chainlink’s CCIP adoption
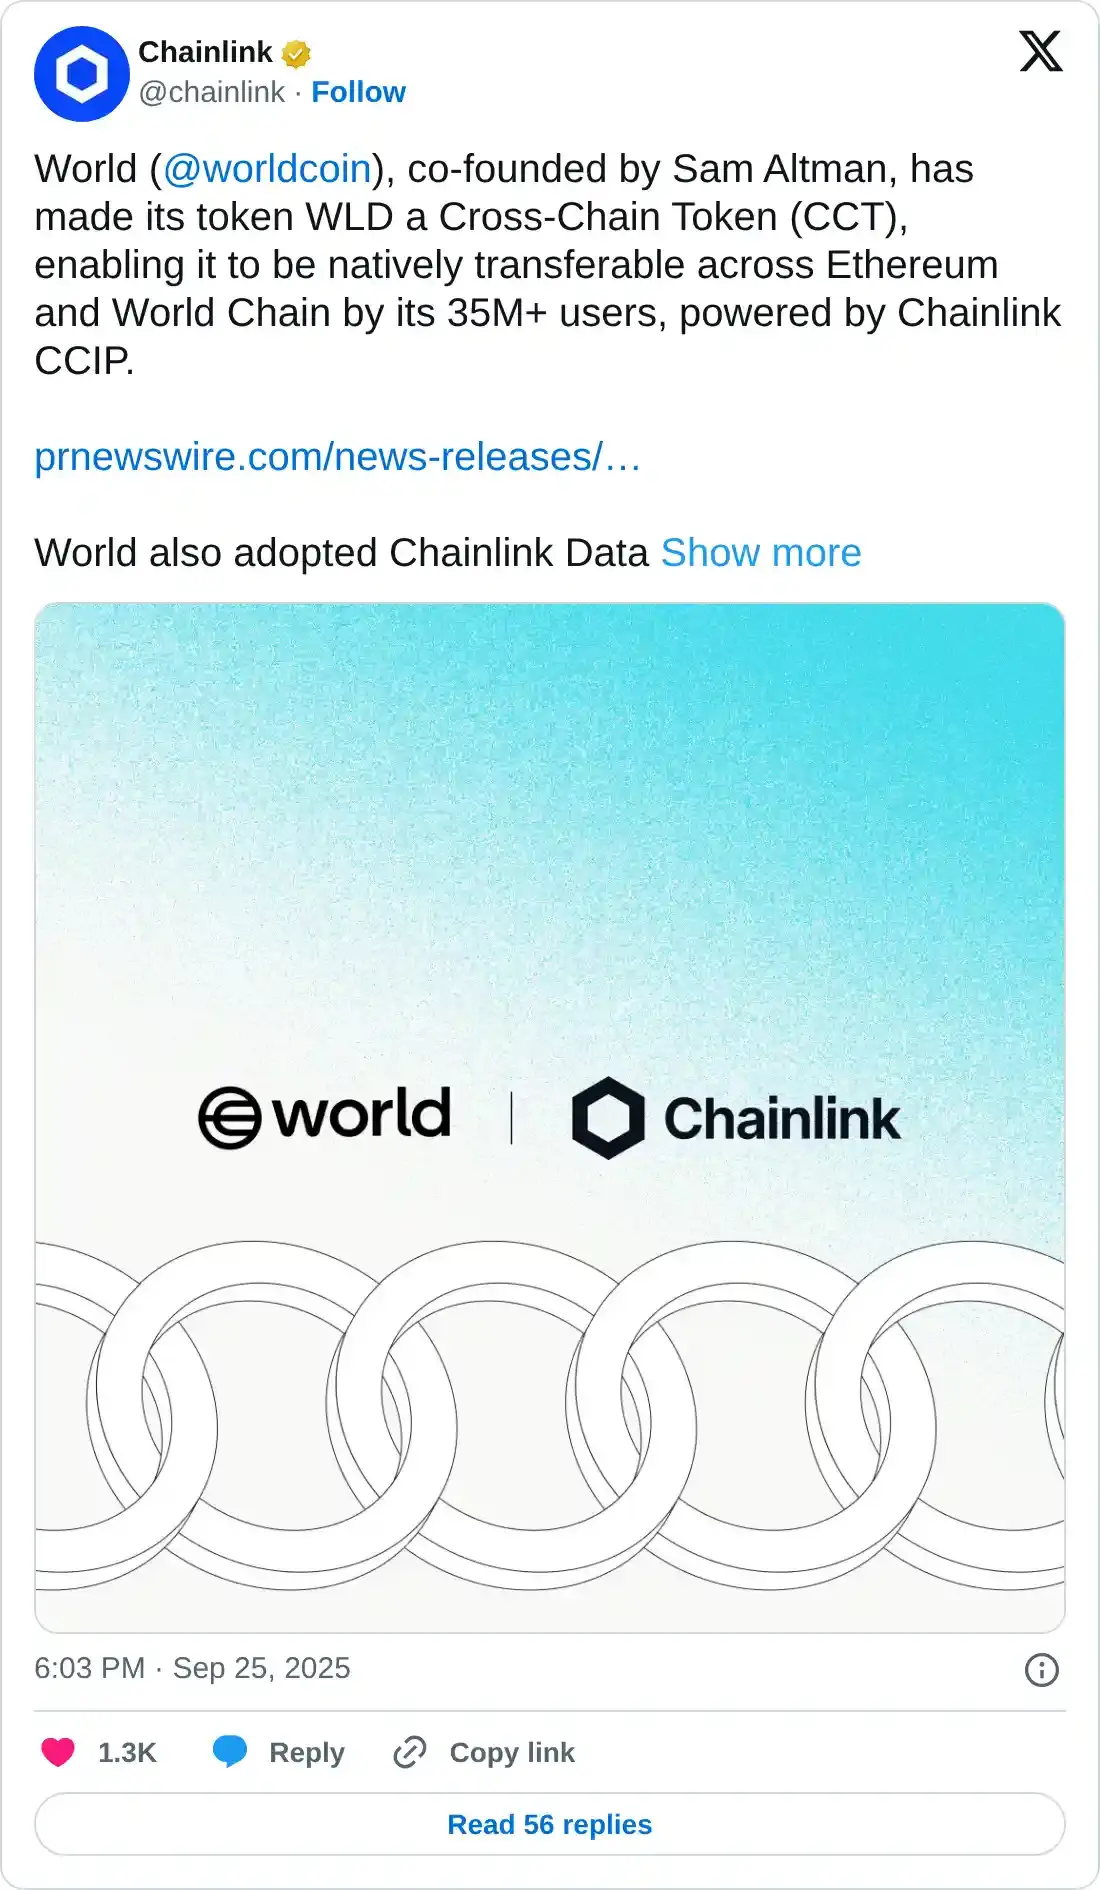
World Chain, a layer-2 network for the World Network, adopted Chainlink’s CCIP on Thursday to expand WLD token transfers to the Ethereum (ETH) network. This interoperability feature will allow its 35 million users to perform cross-chain transfers.
Adding more functionality, World also adopted Chainlink’s data streams to power its Decentralized Finance (DeFi) markets with a low-latency price feed.
Worldcoin edges lower by 1% at press time on Friday, extending the 6.72% drop from the previous day as the broader cryptocurrency market remains under pressure. Still, on the 4-hour chart, WLD forms a falling wedge pattern, which typically results in a bullish rebound.
If Worldcoin marks a decisive close above the 200-period Exponential Moving Average (EMA) at $1.314, it would confirm the wedge breakout. The breakout rally could encounter resistance at the $1.526 high from Sunday, followed by the $1.711 level last tested on September 14.
The momentum indicators on the same chart suggest stagnation in selling pressure, as the Relative Strength Index (RSI) at 35 remains flat above the oversold zone. Additionally, the Moving Average Convergence Divergence (MACD) indicator shows a sideways shift in the average lines, displaying an indecisive trend in motion.
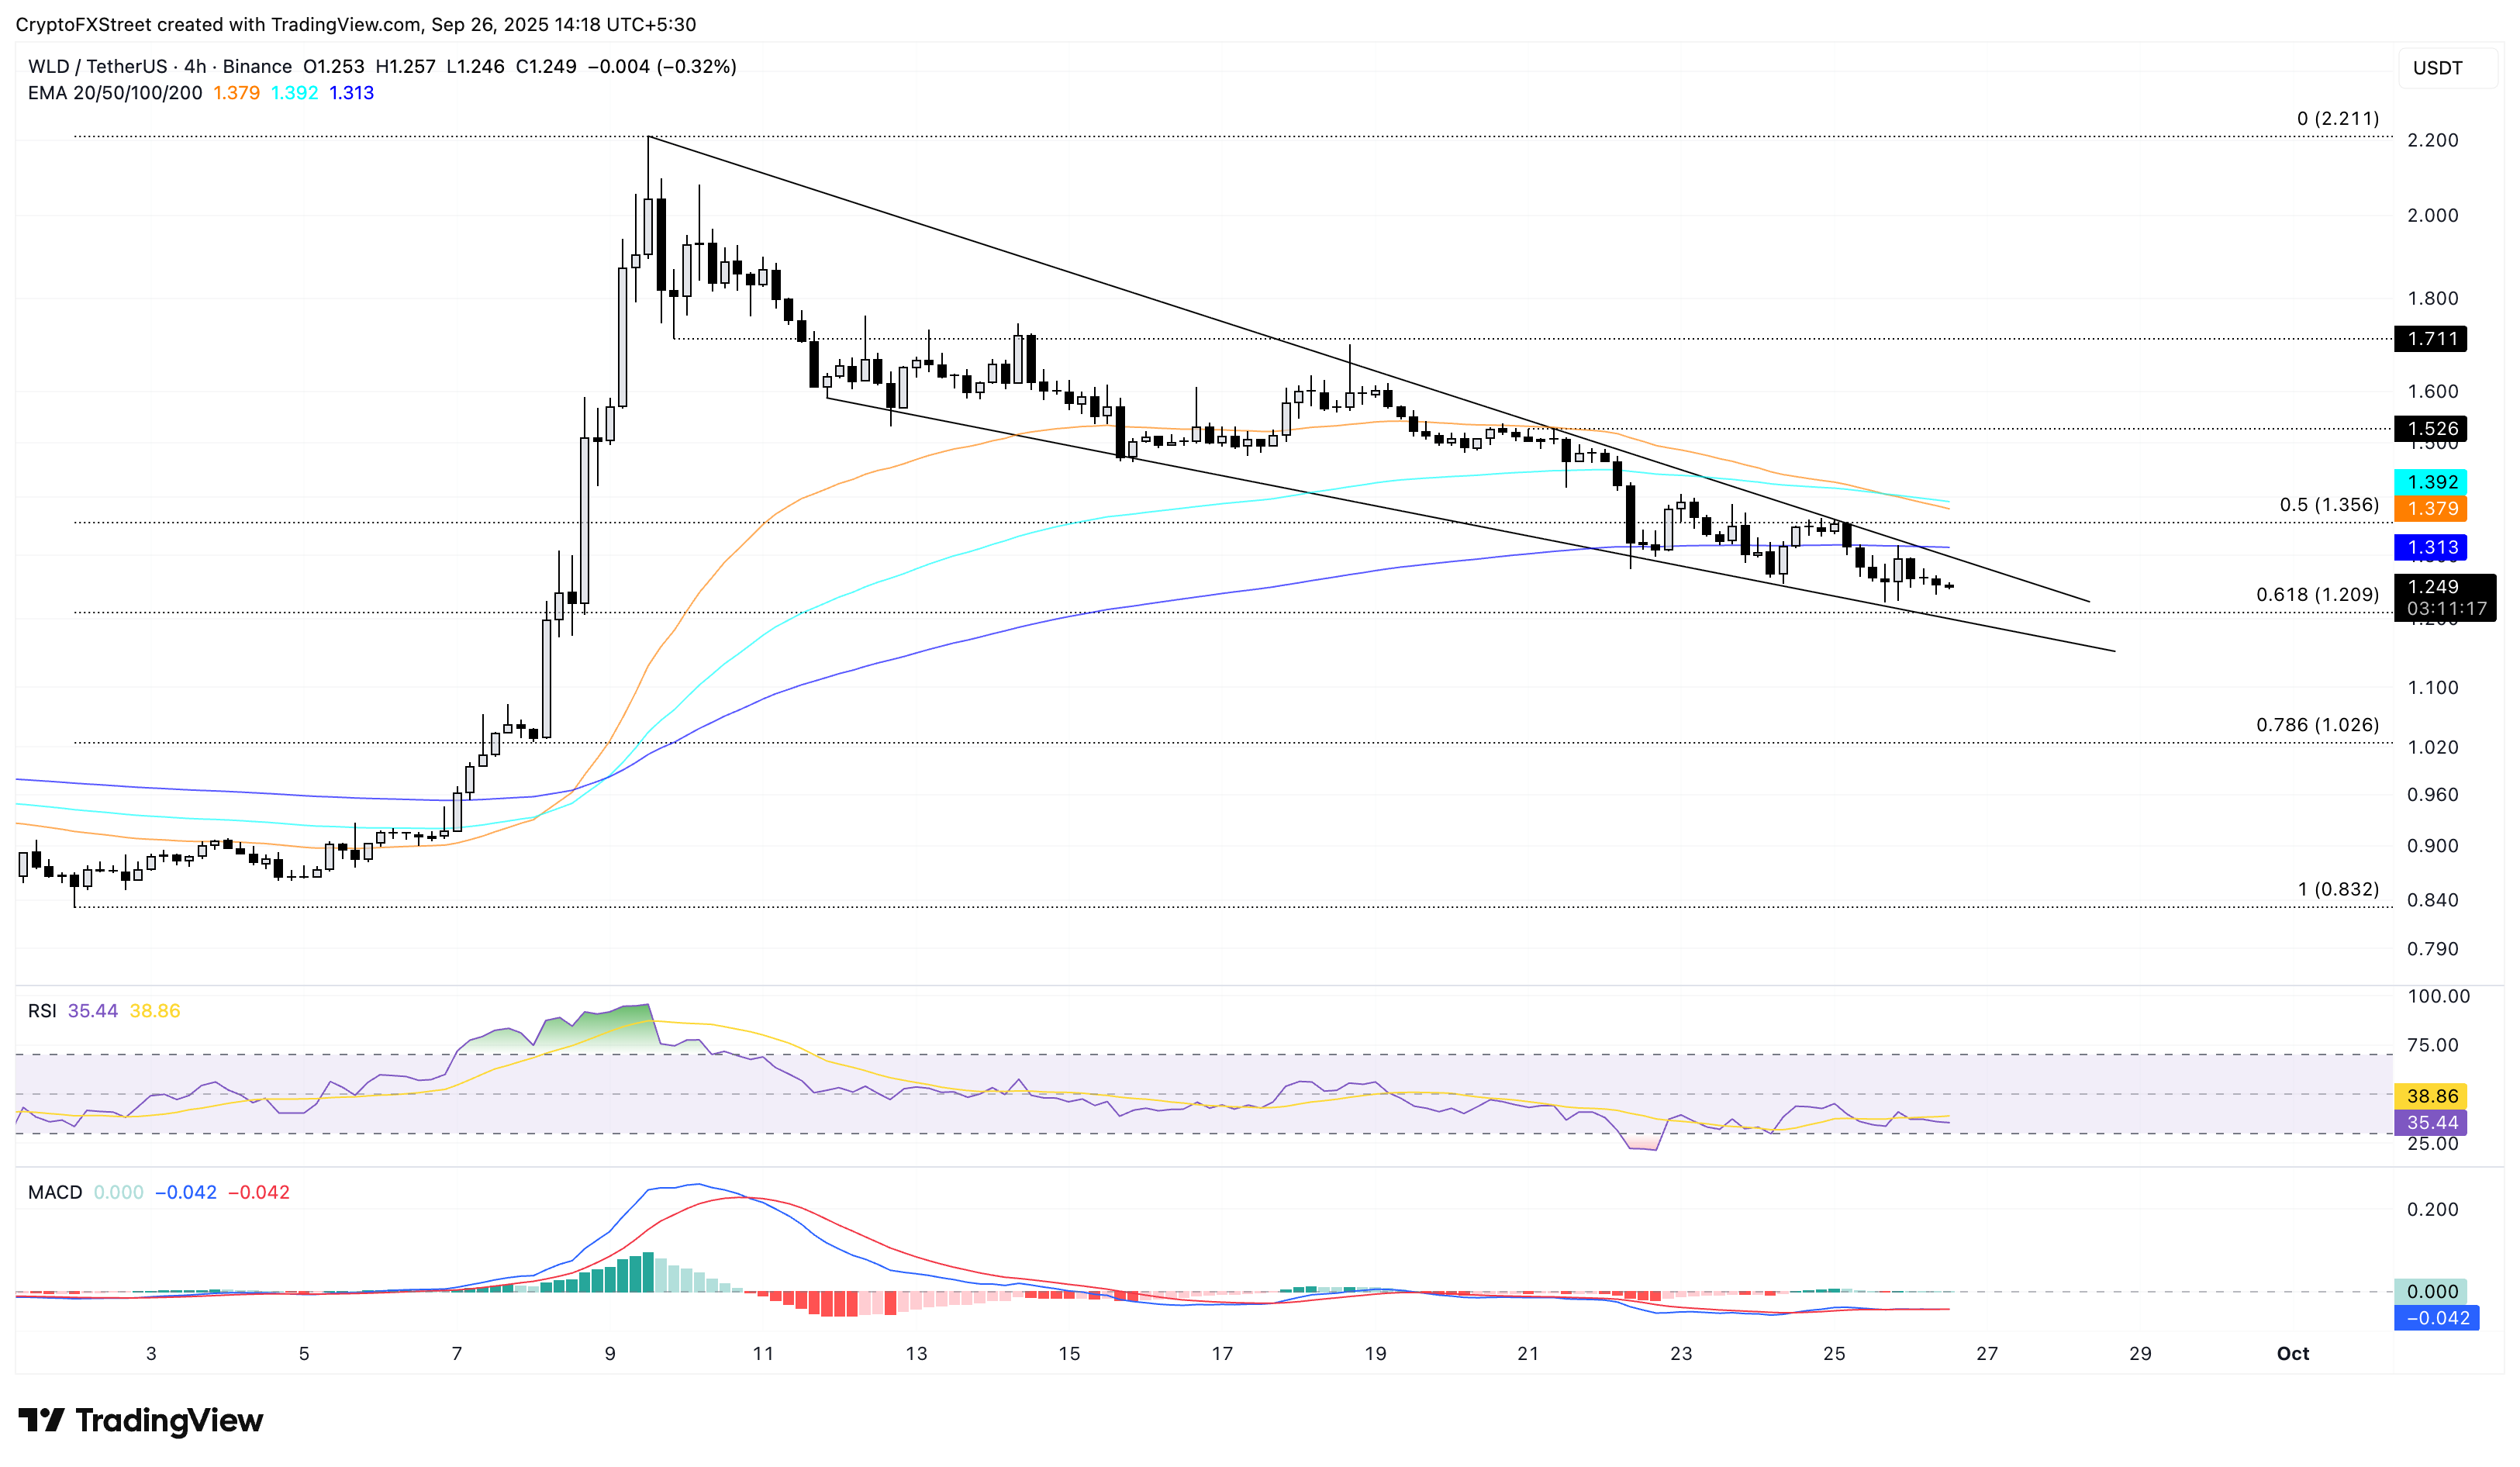
WLD/USDT 4-hour price chart.
Looking down, a potential close below the 61.8% Fibonacci retracement level at $1.209, which is drawn from the $0.832 on September 2 to the $2.221 on September 9, would mark the wedge pattern fallout. The breakout rally could potentially test the $1.000 psychological milestone.
Chainlink risks further losses, ignoring the token buyback
Chainlink reserve purchased an additional 47,903.09 LINK tokens on Thursday, expanding its holdings to 371,019 LINK. Despite the buyback, LINK price registered a 6.76% drop.
At the time of writing, LINK appreciates over 1% on Friday, attempting to reclaim the 100-day EMA at $20.48. Still, CoinGlass data shows a decline in LINK Open Interest (OI) of nearly 2% in the last 24 hours, standing at $1.22 billion. This decline in capital allocated to LINK derivatives suggests that traders are shifting to the sidelines as risk-off sentiment brews.
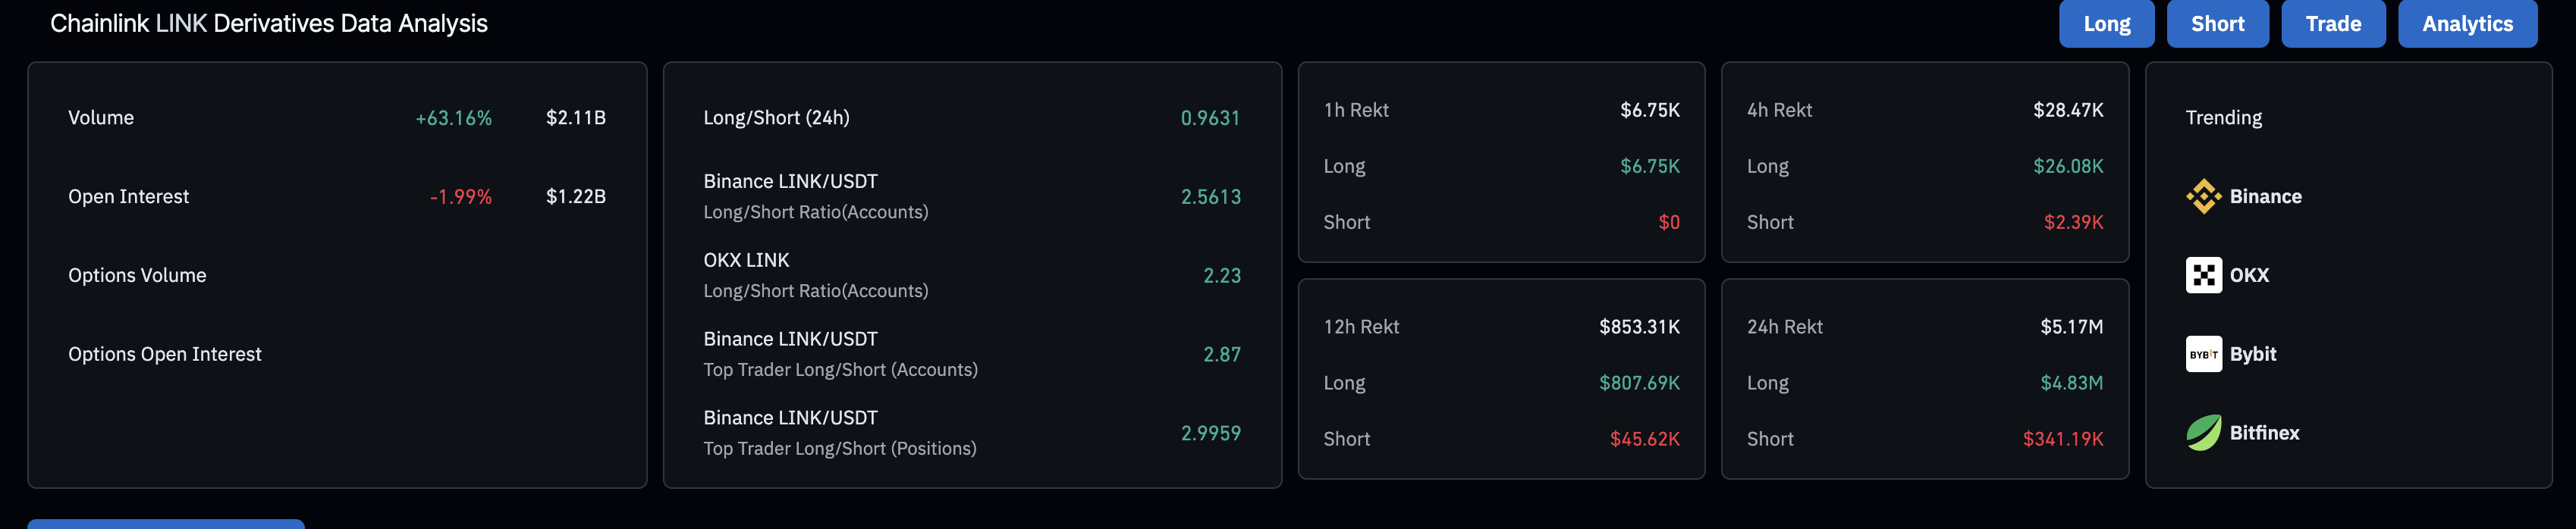
Chainlink derivatives data. Source: CoinGlass
If the declining trend persists, LINK could test the 200-day EMA at $18.70.
The momentum indicators on the same chart display a surge in selling pressure as the RSI at 36 approaches the oversold zone. Additionally, the MACD and its signal line extend the downward trend, indicating a rise in bearish momentum.
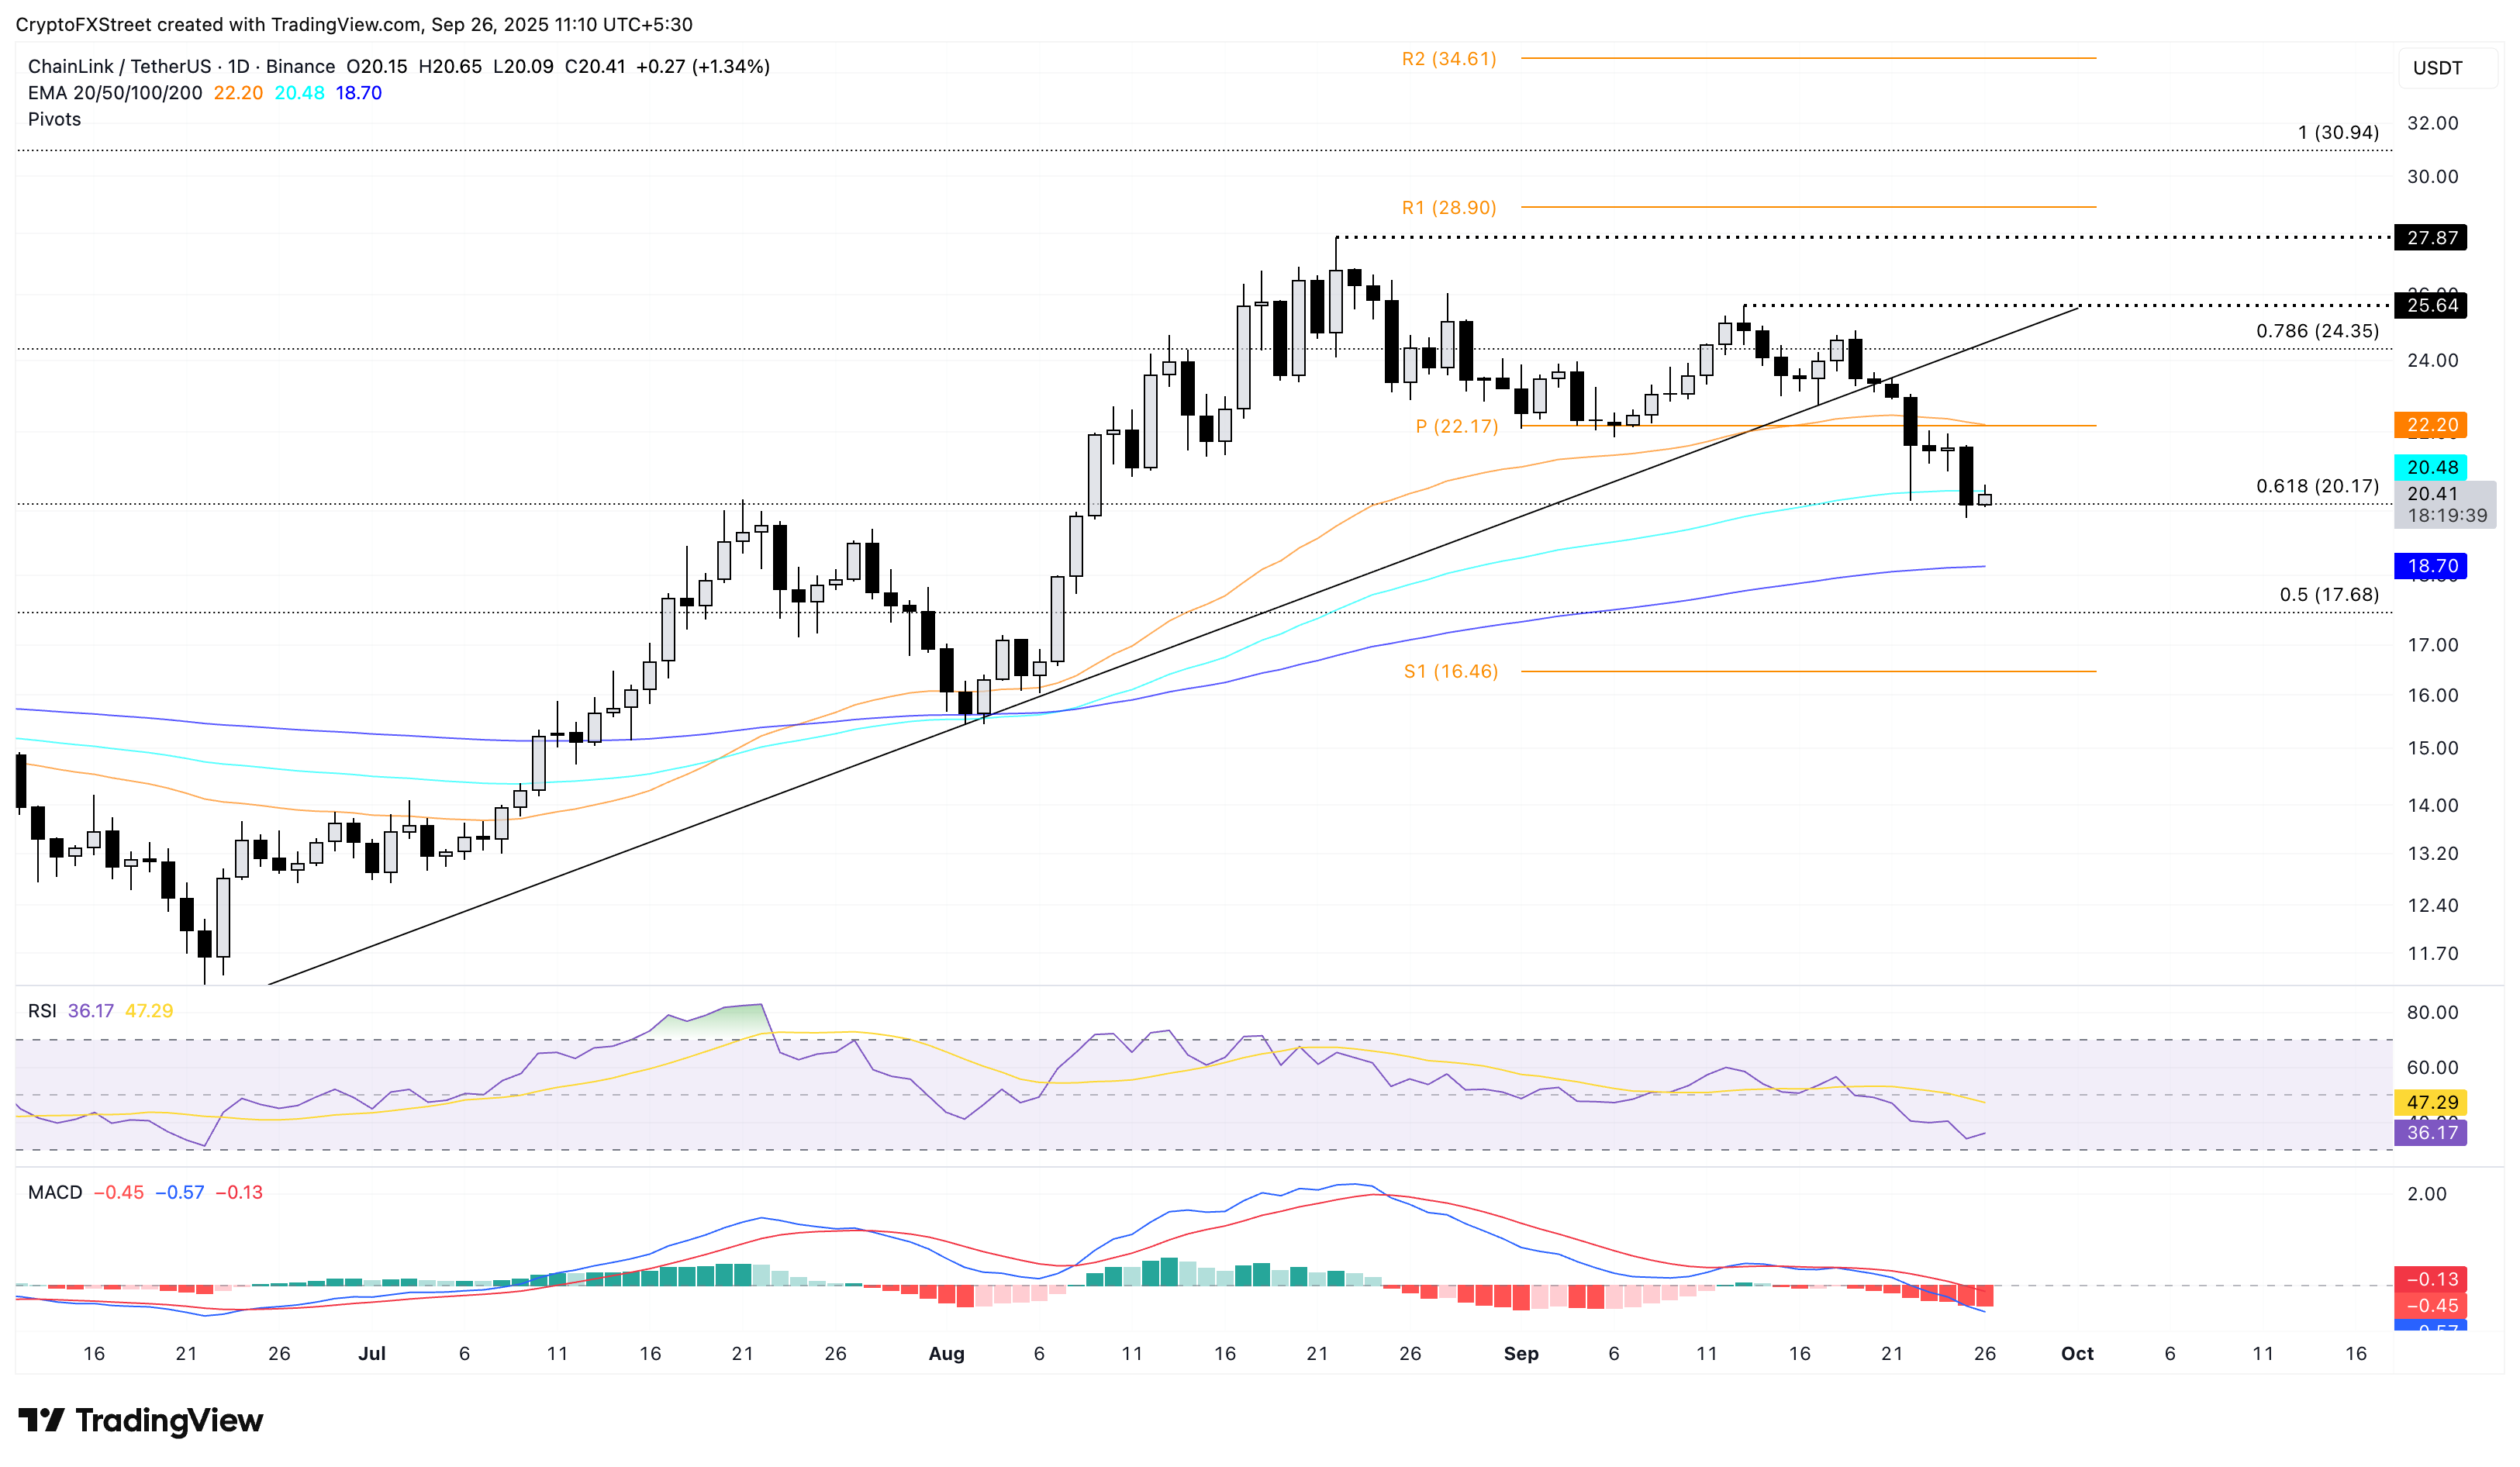
LINK/USDT daily price chart.
On the upside, if Chainlink resurfaces above the 100-day EMA with a daily close, it could retest the 50-day EMA at $22.20.
Author

Vishal Dixit
FXStreet
Vishal Dixit holds a B.Sc. in Chemistry from Wilson College but found his true calling in the world of crypto.


