|

Will this time be different as Bitcoin recaptures 2019 highs?

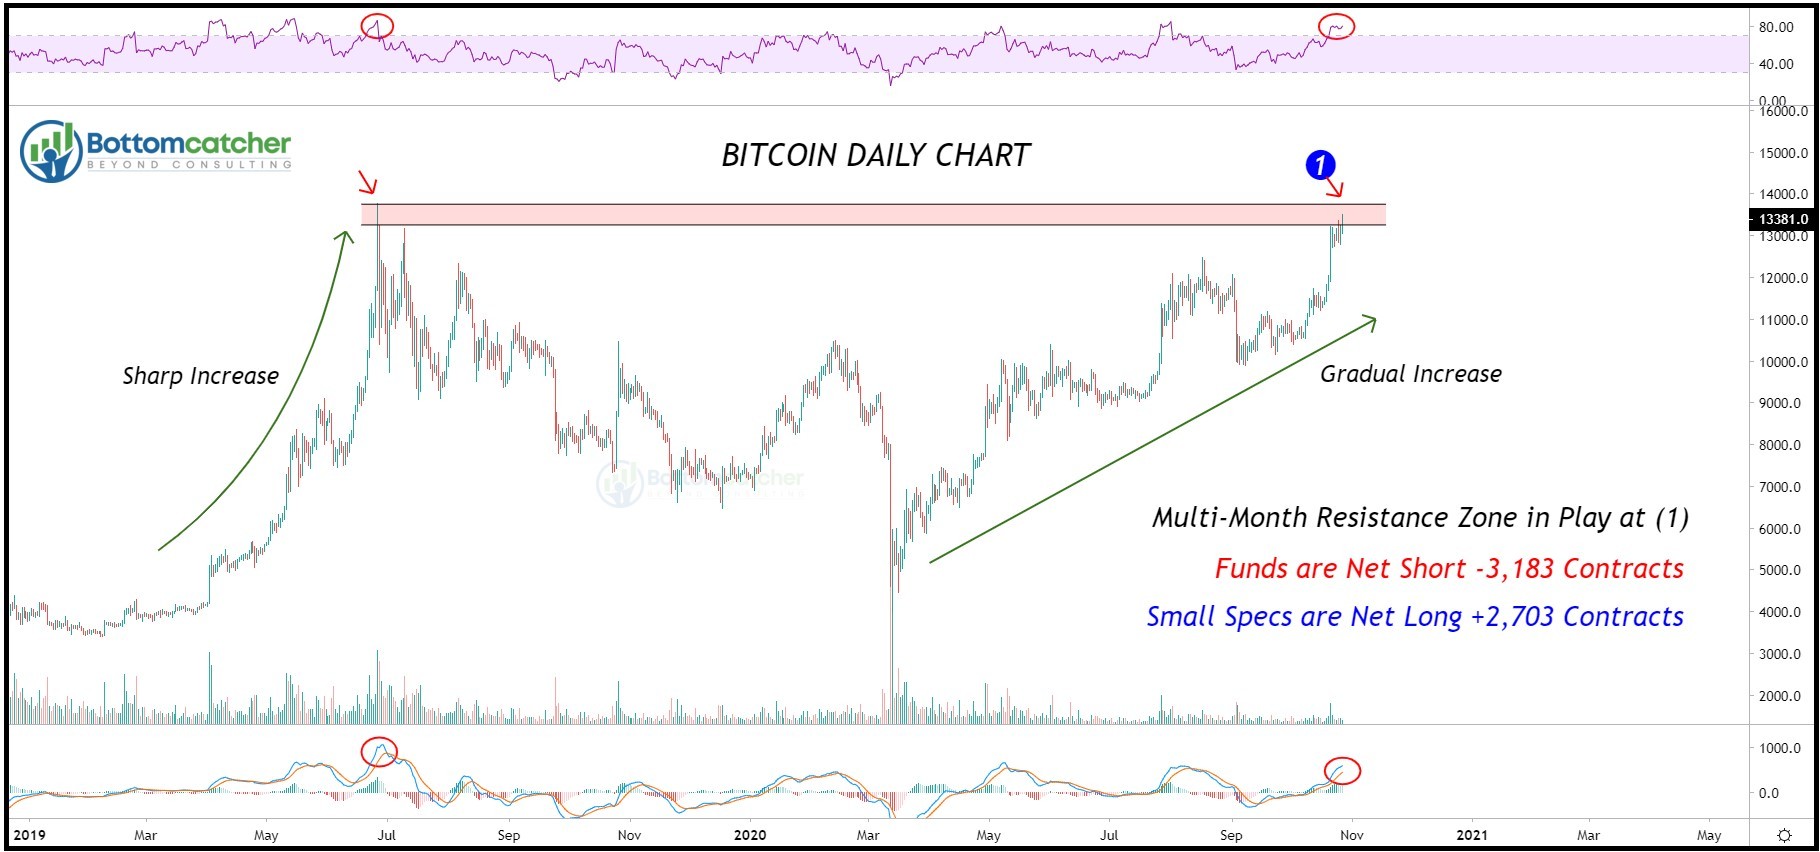
Back in June 2019, small speculators were displaying high levels of optimism for Bitcoin and were becoming overly enthusiastic about prices reclaiming the 2017 highs. Similar optimistic readings are also apparent now as Bitcoin comes to neck and neck with the 2019 June highs at (1). What followed the 2019 optimistic highs was nothing short of a disheartening decline, pretty much the same as what happened after the December 2017 highs, although not quite so brutal.

Could this time be different as we enter the multi-month resistance zone that proved fatal back in 2019? Perhaps.

Looking at the daily chart we can see that this time around the gradual increase in price action from the March lows of this year was far different from the sharp increase from the March lows of 2019. Does this amount to much on its own? not especially, except that gradual increases are considered more of a trend rather than blow off moves which Bitcoin experienced especially during the latter part of 2017.

For the short-term, this psychological resistance zone (1) could provide a selling opportunity as profit-taking from longs will no doubt be on the cards for short to midterm holders. However, any weakness at these levels will only provide a better buying opportunity for dip buyers wanting to board this trend.
Bitcoin

Author

Steven Mylonas

Steven Mylonas

Bottomcatcher.com

With more than 20 years of experience, Steven has a broad knowledge of market strategies and the markets in general, with a strong focus and understanding of data reading.


More from Steven Mylonas
Share:

Editor's Picks

Bitcoin Weekly Forecast: BTC retreats as macro headwinds grow
Bitcoin (BTC) remains under pressure, down over 4% this week and trading around $76,900 at the time of writing on Friday. Institutional demand shows signs of weakness as spot BTC Exchange Traded Funds (ETFs) are on track to end their three-week inflow streak, recording nearly $500 million in net outflows through Thursday.
XRP falls toward key support as macro uncertainty, weak momentum cap recovery
Ripple (XRP) falls below $1.33 on Friday, marking the third consecutive day of declines. The token continues to track the broader cryptocurrency market downturn, with investors closely monitoring heightened macroeconomic uncertainty ahead of the United States (US) Consumer Price Index (CPI) release and next week’s Federal Reserve (Fed) monetary policy decision.
Crypto Today: Bitcoin, Ethereum, XRP stabilize at lower levels amid ETF outflows and macroeconomic risks
The broader cryptocurrency market is rising on Friday, with Bitcoin (BTC) trading above $77,000 after testing lower support near $76,500. Ethereum (ETH) shows signs of stability, hovering above the support provided at $2,400 despite capped upside at $2,500. Meanwhile, Ripple (XRP) holds above $1.33 after three straight days of declines, reflecting growing headwinds due to macroeconomic uncertainty.
Bitcoin pulls back as another golden cross fails to deliver
Earlier this week, Bitcoin formed a golden cross, a technical signal that occurs when the price’s 50-day moving average rises above the 200-day moving average and is conventionally viewed as a precursor to a bullish rally. Historically, however, that’s often not been the case.
Bitcoin: Gearing up for a sharp move
Bitcoin (BTC) is trading around $81,000 on Friday, up over 4% so far this week, and awaits a key catalyst that could determine its next directional move. Strong institutional demand is supporting the bullish price action, with spot BTC Exchange Traded Funds (ETFs) on track to record a third straight week of inflows.

