Will Chainlink price manage to pull off another 19% rise, or is a fall to $5.9 more likely?
- Chainlink price is currently trading at $6.9, nearing a critical support level.
- If the bulls push the price beyond the 50% Fibonacci line, a rally to $8.2 is likely.
- A breakdown below the critical support would invalidate the bullish thesis and lead to a decline to $5.9.

Chainlink price failed to post an impressive rally over the last month despite most of the leading altcoins charting significant rises. The altcoin has inched closer to nearing the lows, however, there is still room for recovery.
Chainlink price rise on the cards
Chainlink price is trading at $6.96 after making a feeble rally of 35% in the span of more than five weeks. Over the last couple of days, the candlesticks have been moving downhill and are close to invalidating critical support.
But the confluence of the 50-day Exponential Moving Average (EMA) and the 100-day EMA indicate a solid support level present at $6.77. Tagging this price level could provide LINK with a chance to bounce and then rise toward critical resistance at $7.60.
The Relative Strength Index (RSI) is also in the bullish neutral zone above the 50.0 mark, which suggests the altcoin is still away from a definite bearish outlook.
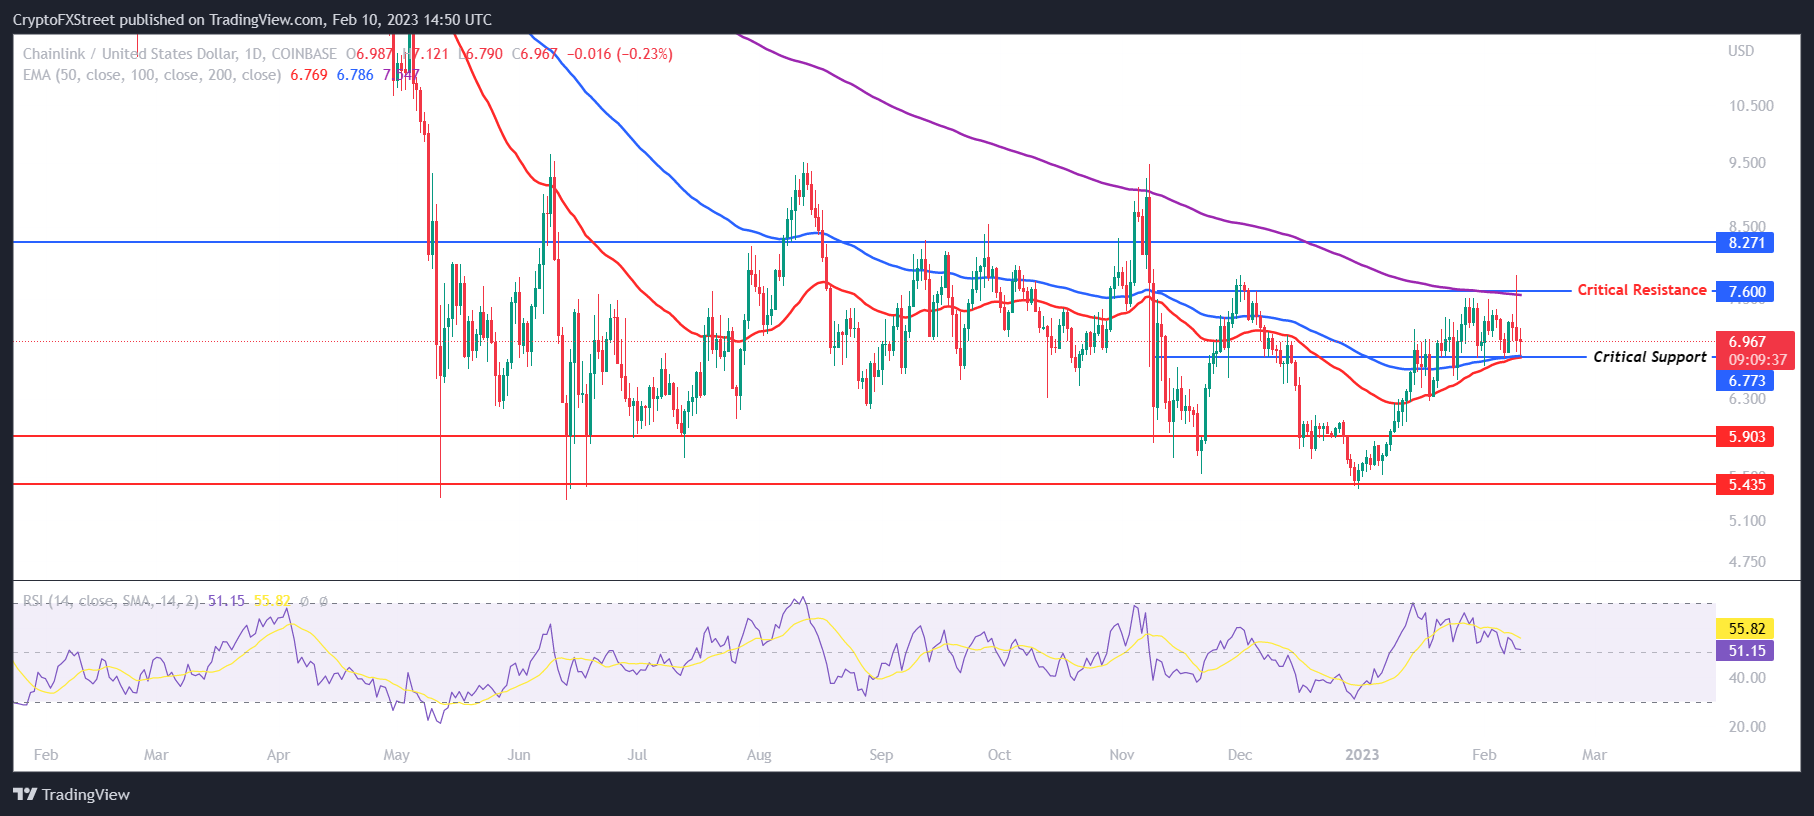
LINK/USD 1-day chart
If Chainlink price manages to breach the critical resistance level at $7.60, with the help of the bulls, the altcoin might be able to make it to $8.27. Flipping it into a support floor would also provide LINK with the support of the 78.6% Fibonacci retracement line of the decline from $8.92 to $5.79. Further bullishness from traders would result in the altcoin tagging the highs of $9.60, marking a 38.19% rally.
On the other hand, a daily candlestick close below the critical support level of $6.77 would leave Chainlink price vulnerable to a fall to $5.90. This would result in a steep 15% crash for the cryptocurrency.
Falling through the latter level would bring LINK to year-to-date lows of $5.43, invalidating all of January’s 35% rise.
Author

Aaryamann Shrivastava
FXStreet
Aaryamann Shrivastava is a Cryptocurrency journalist and market analyst with over 1,000 articles under his name. Graduated with an Honours in Journalism, he has been part of the crypto industry for more than a year now.


