Will Bitcoin hit its $35,000 target in April: BTC deep dive
- Bitcoin analysts have identified the formation of a “cup and handle” in BTC’s daily price chart, with a minimum target of $35,000.
- Experts have identified April as the month when Bitcoin tests resistance at the $30,000 level, and $32,000, the key support from January 2022.
- Bitcoin on-chain activity has increased as sharks and retail investors accumulate BTC, and the asset is getting re-distributed.

Bitcoin has emerged as one of the assets with the highest yield for holders in 2023. With BTC dominance rising, analysts are bullish on the digital asset’s comeback to the $35,000 level.
Experts believe the January 2022 support at $32,000 could get re-tested in April and set a minimum target of $35,000 for the Bitcoin price. A range of on-chain metrics supports the bullish thesis for Bitcoin.
Also read: Why Vitalik Buterin is bullish on ZK coins
Bitcoin chart reveals formation of “cup and handle,” what to expect
Jackis, a trader and crypto analyst, identified a “cup and handle” formation on Bitcoin’s one-day price chart. While the “cup and handle” formation is not a classical chart pattern, Jackis argues that fitting the current BTC structure in it sets a target of $35,000 for the Bitcoin price.
The analyst believes a clean break above the $32,500 high would set BTC up for a rally to the $35,000 target.
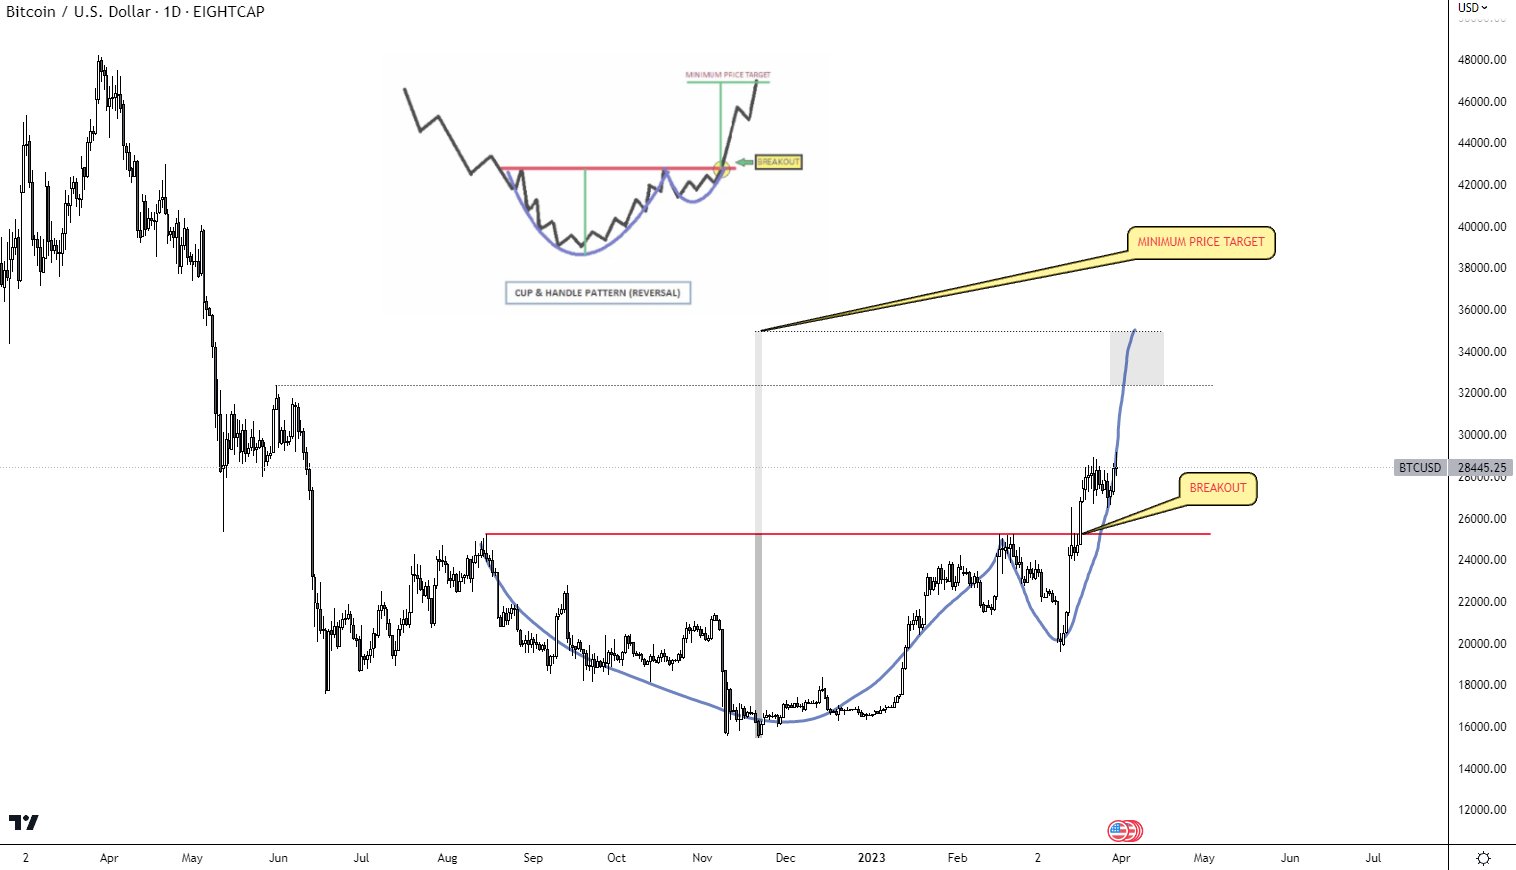
BTC/USD 1D price chart
The cup and handle formation indicates an asset’s price movement in cup form, followed by a downtrend, a handle formation. When the handle formation is complete, it is typically followed by a new all-time high in the asset’s price.
Bitcoin supply redistribution to retail investors holding between 0.1 to 10 BTC is considered a bullish signal. Accumulation of the asset by retail investors is a bullish sign. While large wallet investors and whales are engaging in profit-taking, the asset is redistributed to retail investors.
%20[18.45.41,%2002%20Apr,%202023]-638160399384857360.png)
BTC accumulation by retail investors
On-chain metrics supporting Bitcoin adoption and growth
The supply of Bitcoin on exchanges has consistently declined since March 30, based on data from the crypto intelligence tracker Santiment. A decrease in BTC supply on exchanges is bullish as it reduces the volume of Bitcoin available for sale, a reduction in selling pressure on the asset.
Interestingly, the timeline coincides with the decline in whale transactions, greater than $100,000 worth of BTC.
%20[18.46.11,%2002%20Apr,%202023]-638160399678598633.png)
BTC supply on exchanges, whale transaction count and Bitcoin price
Will Bitcoin test $32,000 in April?
Crypto analyst and YouTuber Jason Pizzino believe that the largest asset by market capitalization is following a Wyckoff accumulation pattern. This is a pattern that lasts four phases, and the analyst believes we are in the accumulation phase in BTC. This implies the asset is forming the base for a bull market.
Pizzino believes April is conducive to BTC testing its January 2022 support at $32,000. In his recent YouTube video, Pizzino was quoted as saying:
...I think April may be the month that we come up to test the $30,000 and the low $30,000 area, so about $32,000, which is the previous lows and support of January 2022… That is going to be a key area.
If Pizzino’s thesis is validated, Bitcoin could test the January 2022 support and conquer the level in its uptrend to the $35,000 bullish target.
Author

Ekta Mourya
FXStreet
Ekta Mourya has extensive experience in fundamental and on-chain analysis, particularly focused on impact of macroeconomics and central bank policies on cryptocurrencies.


