Why Algorand can hit $3 over the next few weeks
- Algorand price has spent nearly sixty days in a consolidation pattern.
- Bulls have been positioning Algorand for a bullish breakout within the Ichimoku Kinko System.
- The $3.00 price level is the next major high and target.

Algorand price action has been mostly constrained between the $1.62 and $2.14 value areas over the past two months. Multiple attempts by bulls to break out higher have not met with success;at the same time bears have been prevented from moving Algorand lower. A pattern now appears to be forming which may end this impasse.
Algorand price eyes a breakout to hit a new all-time high at the $3.00 value area
Algorand price has formed a very textbook example of what a bull flag looks like. Bull flags are consolidation channels that show up after an uptrend. In technical analysis, consolidation after a strong uptrend is considered a sign of strength and trend continuation.
The Ichimoku Kinko Hyo system can assist with identifying appropriate price levels that would indicate a new uptrend is likely to occur. Algorand price buyers would only want to go long when the daily close is above the Cloud, Tenkan-Sen, and Kijun-Sen. Additionally, buyers will want to ensure the Chikou Span is above the candlesticks and in open space.
The Algorand price daily close needs to be at or above $2.30 to confirm buyers' positive and robust breakout.
However, the same is true for the downside. Bears have been equally interested in creating strong shorting conditions for Algorand. It is more difficult for Algorand to move lower than it is to move higher. Sellers have to contend with pushing a daily close below the 50% Fibonacci retracement at $1.62 to create any shorting opportunities.
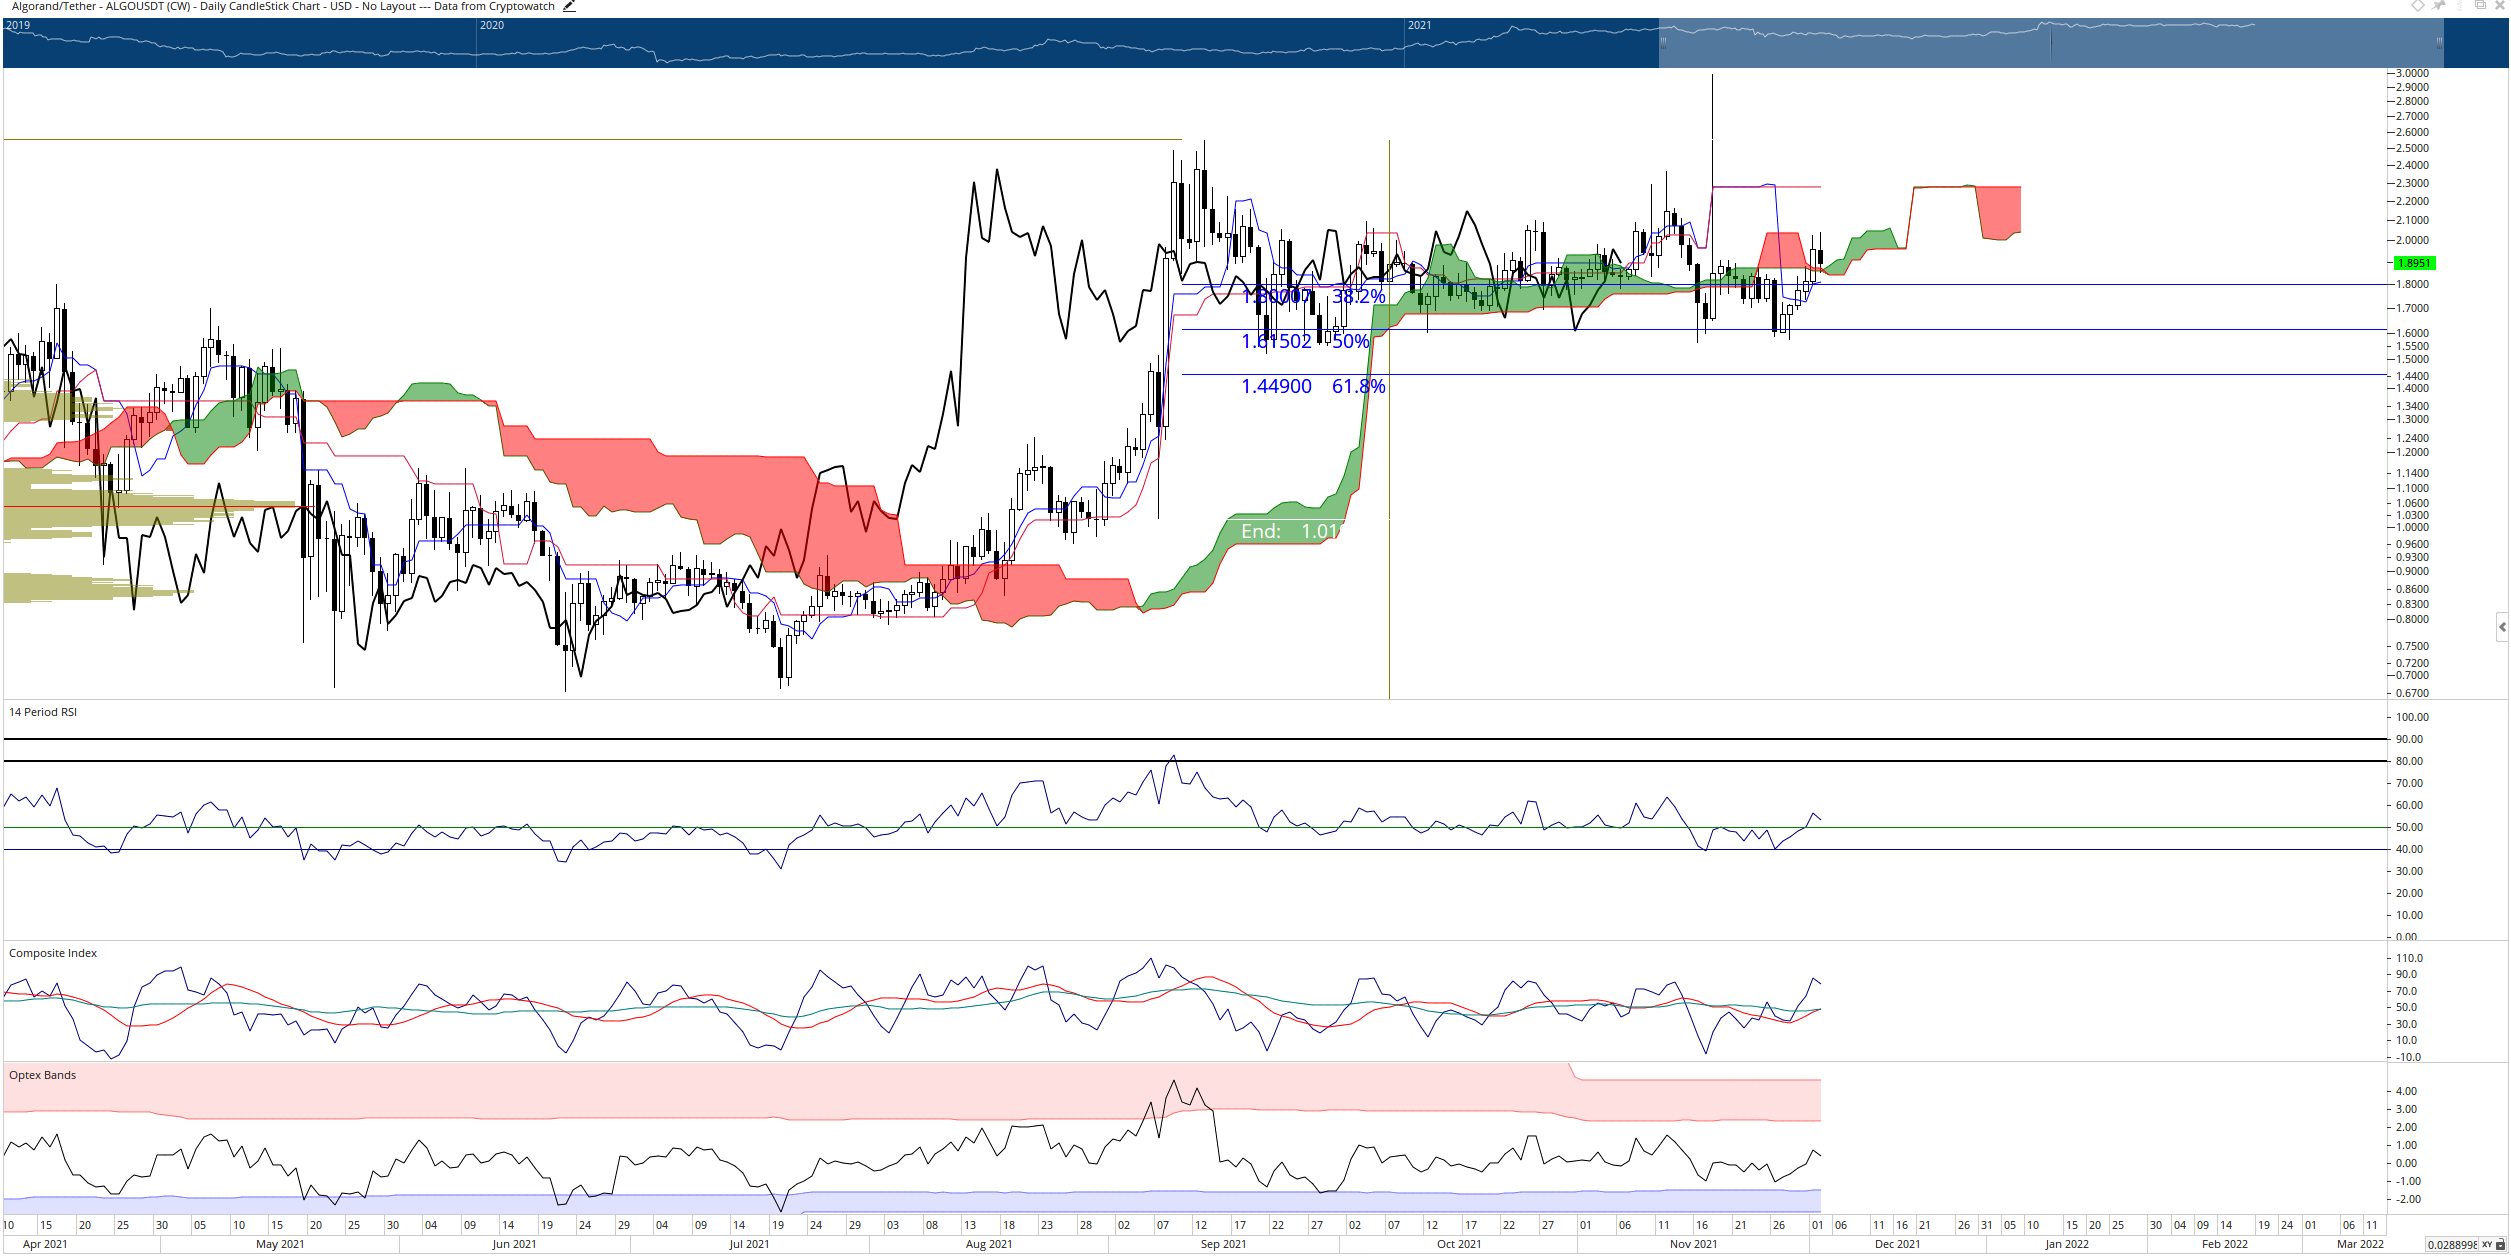
ALGO/USDT Daily Ichimoku Chart
Even if sellers can even push Algorand price below the 50% Fibonacci retracement, downside risks are, however, minimal. In addition, a high volume node in the 2021 Volume Profile and the 61.8% Fibonacci retracement share the $1.45 value area, limiting any potential swings south.
Author

Jonathan Morgan
Independent Analyst
Jonathan has been working as an Independent future, forex, and cryptocurrency trader and analyst for 8 years. He also has been writing for the past 5 years.
More from Jonathan Morgan




