VETUSD Elliott Wave technical analysis [Video]
![VETUSD Elliott Wave technical analysis [Video]](https://editorial.fxsstatic.com/images/i/crypto-02_XtraLarge.jpg)
VETUSD Elliott Wave technical analysis
Function: Follow the trend.
Mode: Motive.
Structure: Impulse.
Position: Wave II.
Direction (Next higher degrees):
Wave cancel invalid level:
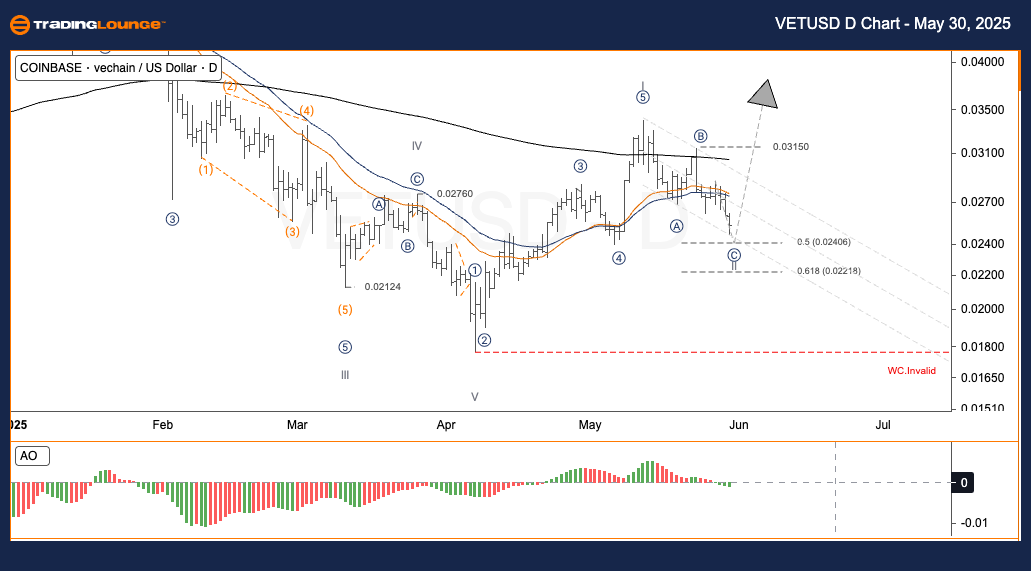
After VeChain bounced from a low of $0.0212 during major wave V, it surged to a recent high of $0.0315 in sub-wave ⑤. Now, the price has entered an A-B-C correction pattern. This phase reflects a pause in the new major uptrend that has just begun.
Currently, the market is moving toward the completion of wave C. The support range between the 0.5 and 0.618 Fibonacci levels is crucial, as corrections often end there and may lead to the start of a new trend.
Trading strategies
-
Strategy type
-
-
For swing traders (Short-term)
-
-
Look for buy-on-dip chances around $0.022–$0.024 with a confirmed reversal signal.
-
Risk Management: Set your stop loss below $0.018 to protect your position.
-
-
VETUSD Elliott Wave technical analysis
Function: Follow the trend.
Mode: Motive.
Structure: Impulsea.
Position: Wave II.
Direction (Next higher degrees):
Wave Cancel invalid level:
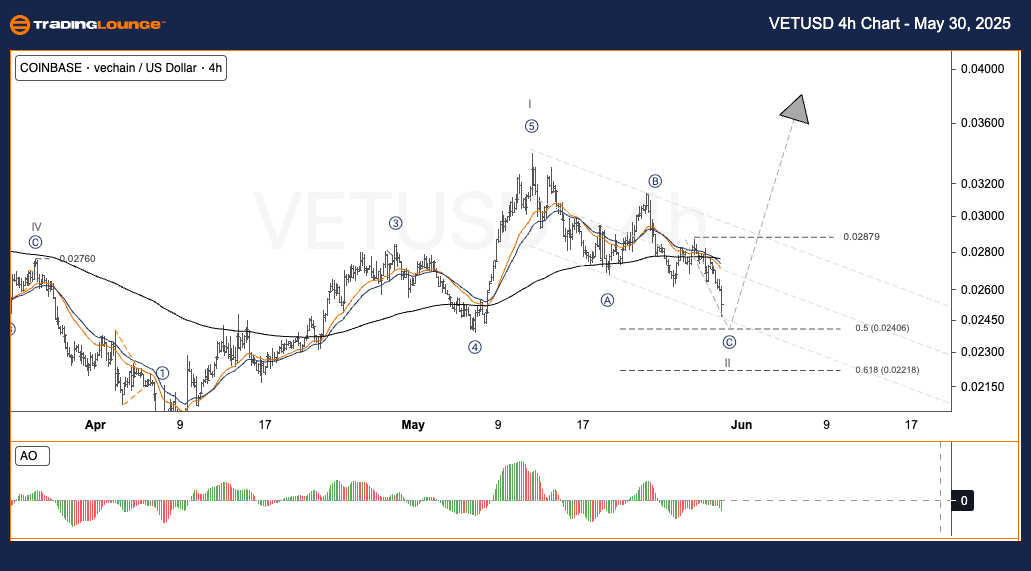
From the recent low at $0.0212 in wave V, VeChain rallied up to $0.0315 during sub-wave ⑤. This was followed by an A-B-C corrective structure – a typical consolidation during early stages of a new uptrend.
As wave C nears completion, support between Fibonacci 0.5 and 0.618 levels becomes important. It’s a zone where corrective patterns often finish, and fresh upward trends may begin.
Trading strategies
-
Strategy type
-
-
For swing traders (Short-term)
-
-
Watch for a reversal and consider entering between $0.022–$0.024.
-
Risk Management: Place a stop loss below $0.018 to limit downside.
-
-
Analyst: Kittiampon somboonsod, CEWA.
Author

Peter Mathers
TradingLounge
Peter Mathers started actively trading in 1982. He began his career at Hoei and Shoin, a Japanese futures trading company.