VeChain Price Prediction: VET on track to hit a new all-time high at $0.087
- VeChain price surged 22% after it bounced from the ascending parallel channel’s lower trendline.
- Now, VET is on track to surge another 45% to hit a new all-time high at $0.087.
- A rejection at the current all-time high at $0.061 could result in a 10% downswing to $0.050.

VeChain price showed impressive 22% gains after sliding more than 40% between February 20 and 28. However, buyers seem to have set their sights to fly past VET’s current all-time high at $0.061.
Vechain price hints at an accumulation
VeChain price has seen two significant higher highs four higher lows since late December 2020. Joining these swing highs and swing lows with trendlines results in an ascending parallel channel formation. Although this technical pattern forecasts a bearish outlook, it is only after a breakout. At the time of writing, VET has bounced off the inclined trendline acting as support at $0.036 on February 28, signaling the start of a new uptrend.
Supporting a continuation of this uptrend is the three consecutive green daily candlestick closes seen since March 5. These trading sessions saw healthy volume bars while the price barely moved, hinting that an accumulation could be in the works. If true, then VET bulls could be gearing up for the next leg of the rally, a 45% upswing towards the top of the channel at $0.087.
Adding credence to this bullish thesis is the green histograms developed above the zero-line, as seen in the Moving Average Convergence Divergence (MACD) indicator. Additionally, this indicator’s MACD line (12 EMA) has sliced above the signal line (26 EMA), indicating a bullish crossover in play.
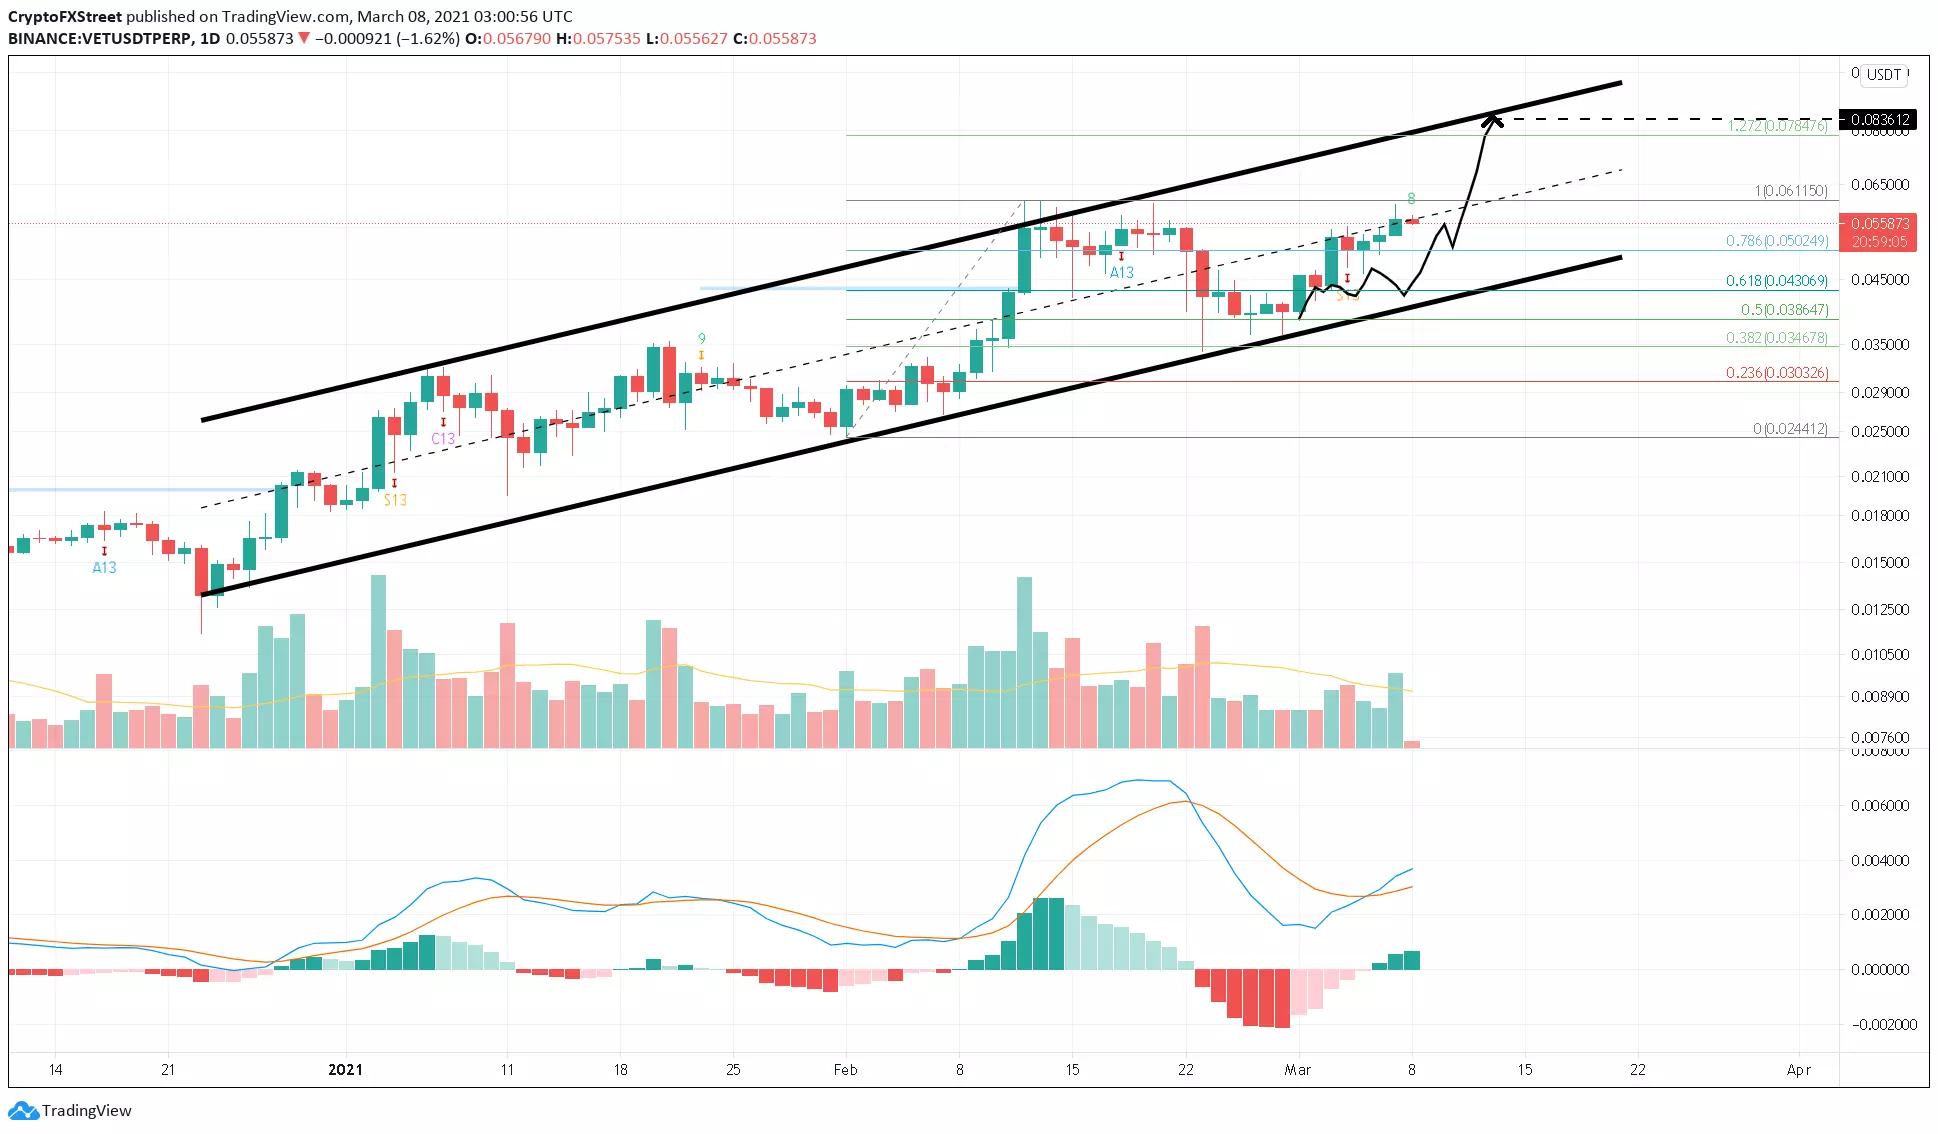
VET/USDT 1-day chart
However, investors should note that the Tom DeMark (TD) Sequential indicator suggests that a potential sell signal could follow the current red eight candlestick formation. In such a case, VeChain price could drop 10% towards the immediate support at $0.050, which coincides with the 78.6% Fibonacci retracement level.
Author

Akash Girimath
FXStreet
Akash Girimath is a Mechanical Engineer interested in the chaos of the financial markets. Trying to make sense of this convoluted yet fascinating space, he switched his engineering job to become a crypto reporter and analyst.


