VeChain Price Analysis: VET should be avoided below $0.088
- VeChain price reaction to the 25.57% decline on June 21 has been corrective, not impulsive.
- May 23 low remains credible support, but an acceleration in downside momentum puts May 19 low in play.
- Anchored VWAP is an imposing level of resistance if VET regains price traction.

VeChain price has created a challenging price structure for market operators after crashing over 25% on June 21 while splintering two strategically important support levels. Based on the underwhelming price action of the last three days, the VET outlook is tilted bearish until the price structure is more coherent and the cryptocurrency complex has absorbed the persistent nervousness.
VeChain price waits for the whales to come out of the depths
VeChain price closed on June 22 with a doji candlestick pattern, signifying a high level of indecision and a virtual stalemate between sellers and buyers. Within the context of a more significant decline, doji patterns can sometimes mark a reversal. Interestingly, a VET reversal did follow over the next two days, but it was highlighted by gains of just 6.3% and 5.6%.
Not the type of impulsive price action that follows a conclusive low or establishes the momentum to overcome two strategically important resistance levels. In fact, from the vantage point of a two-hour or four-hour chart, the weak VET rebound designed a bear flag formation that is triggering today.
The minor response to the 25% decline does expose VeChain price to a deeper decline moving forward. Some support is anticipated at the May 19 low of $0.065 and the June 22 low of $0.059, but a daily close below $0.059 strengthens the outlook forecasting a test of the May 19 low of $0.042.
A sweep below $0.042 could include a brief test of the 78.6% Fibonacci retracement of the rally from the end of December 2020 at $0.039. A VET decline of that magnitude would equate to a 33% loss from the June 22 low for investors.
The fact that the daily Relative Strength Index (RSI) nearly recorded an official oversold reading suggests that VeChain price may not slide much deeper than the May 22 low on a daily closing basis. Of course, the claim’s value is highly dependent on the machinations of the cryptocurrency market.
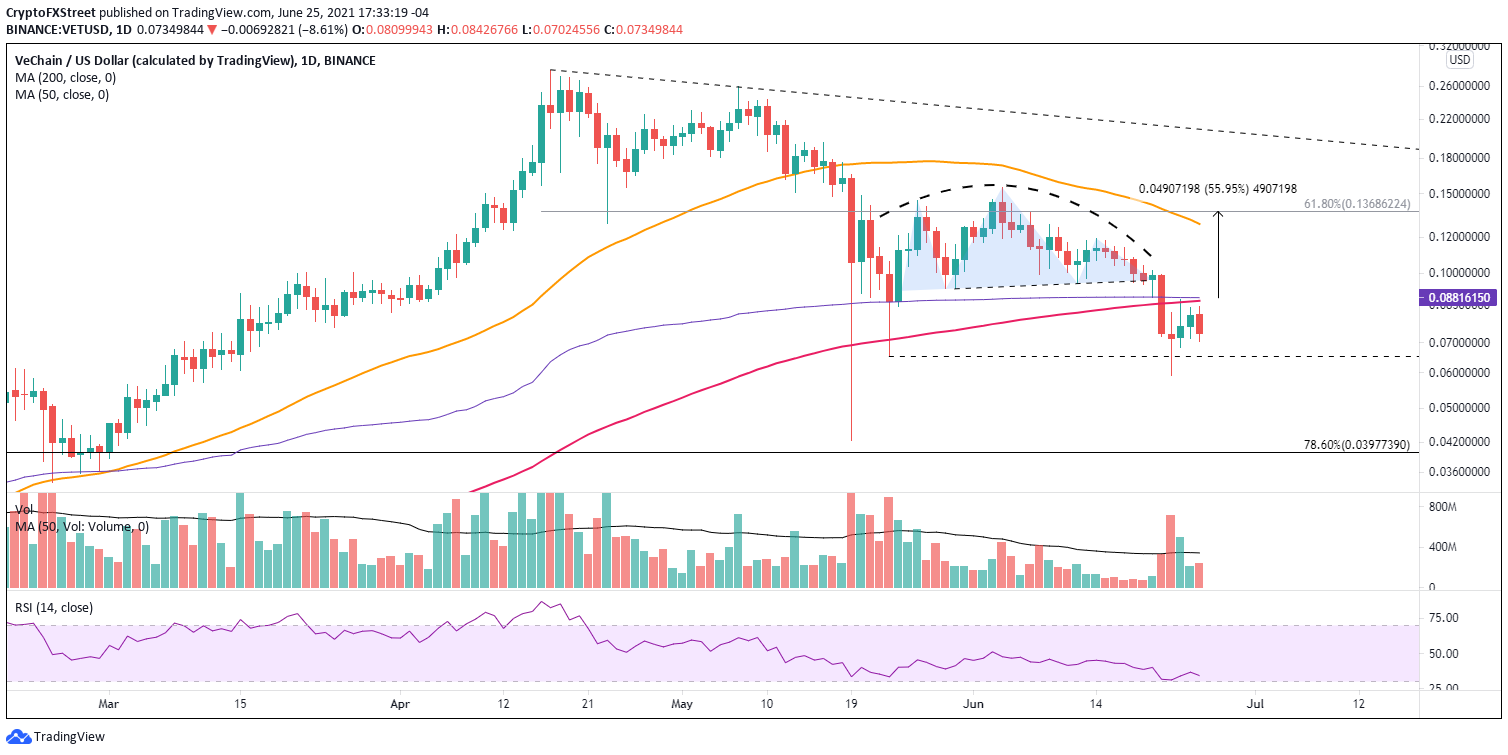
VET/USD daily chart
At this point, a pullback by VeChain price may serve to reinforce support and create the runway for VET to raise the momentum quotient for the next rally. Something of great importance, considering the towering resistance defined by the 200-day simple moving average (SMA) at $0.086 and the anchored VWAP from January 3 at $0.088.
If successful at overcoming the two levels, VeChain price is unrestricted to test the declining 50-day SMA at $0.128 and possibly the 61.8% Fibonacci retracement of the April-May decline at $0.136. It would be an advance that generates a 56% return for VET speculators.
For the moment, VET investors should let the digital token prove itself. There is no reason to rush an entry at these levels. Until the digital token can achieve a daily close above $0.088, it is recommended to let VeChain price enhance the clarity of the short-term investment situation.
Author

Sheldon McIntyre, CMT
Independent Analyst
Sheldon has 24 years of investment experience holding various positions in companies based in the United States and Chile. His core competencies include BRIC and G-10 equity markets, swing and position trading and technical analysis.