|

Uniswap Price Forecast: UNI shows potential for a 46% jump leading to new all-time highs

  • Uniswap price is still trading inside an ascending parallel channel which is part of a daily bull flag.
  • Considering the bullish momentum, a breakout seems more likely for UNI.
  • The IOMAP chart shows practically no barriers on the way up.

Uniswap price has been trading sideways for the past 24 hours inside a bull flag pattern on the daily chart. Most on-chain metrics are in favor of the bulls and indicate that a breakout could happen sooner than later.

Uniswap price needs to break $22.7 to see a massive 46% move towards $33

On the daily chart, Uniswap has established a bull flag and an ascending parallel channel. The upper resistance trendline is formed at $22.7 which is the key for a 46% breakout towards a new all-time high at $33.
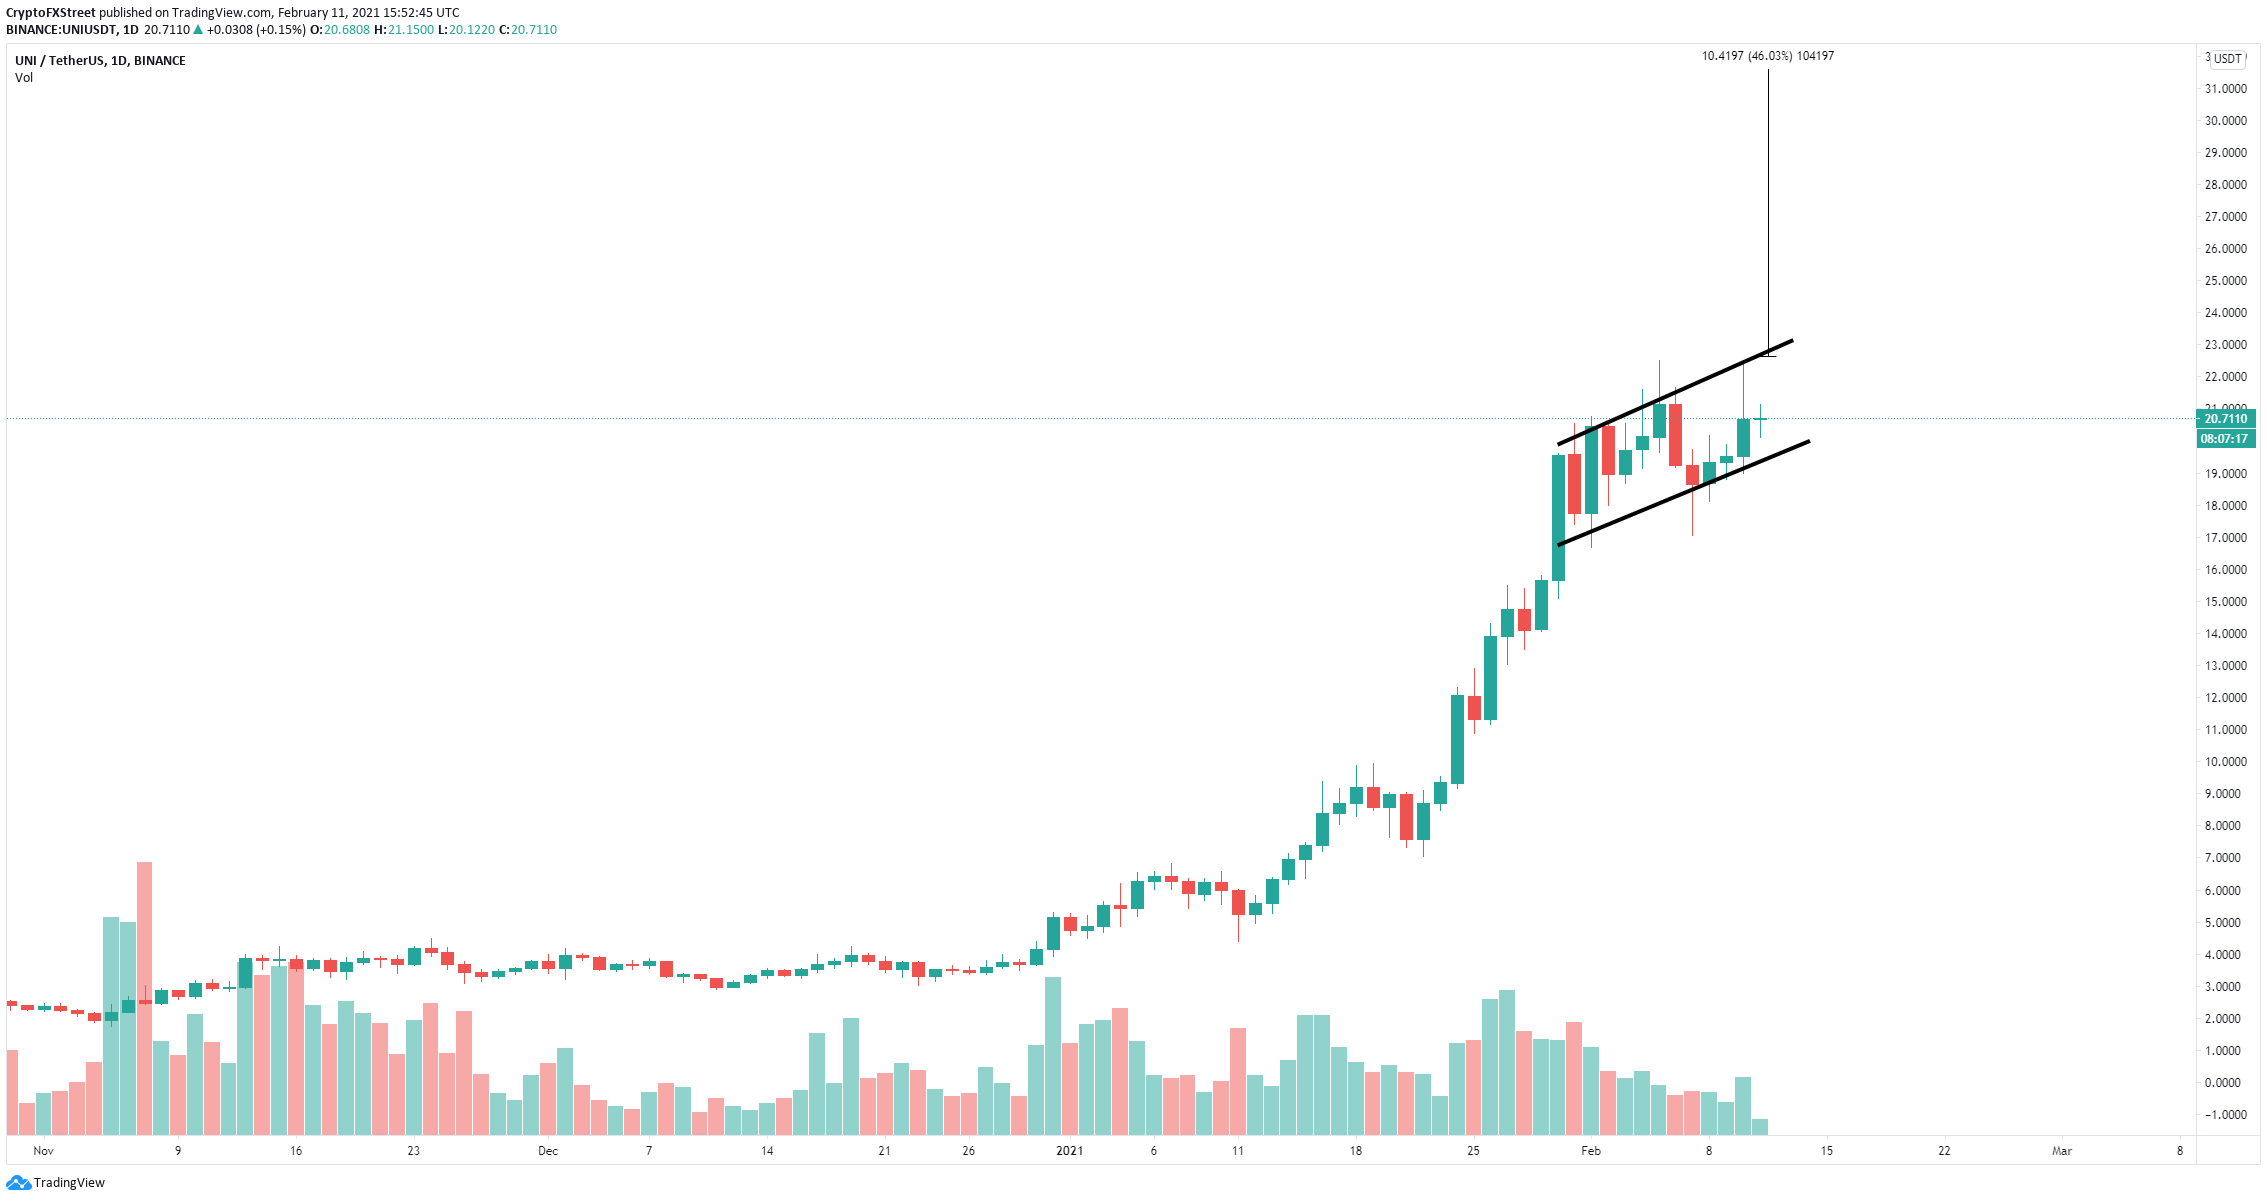
uni price

UNI/USD daily chart 

The In/Out of the Money Around Price (IOMAP) chart indicates that UNI bulls will encounter weak resistance on the way up above $20.7. The most significant resistance area is located between $21.1 and $21.3 with 1.23 million UNI in volume. 
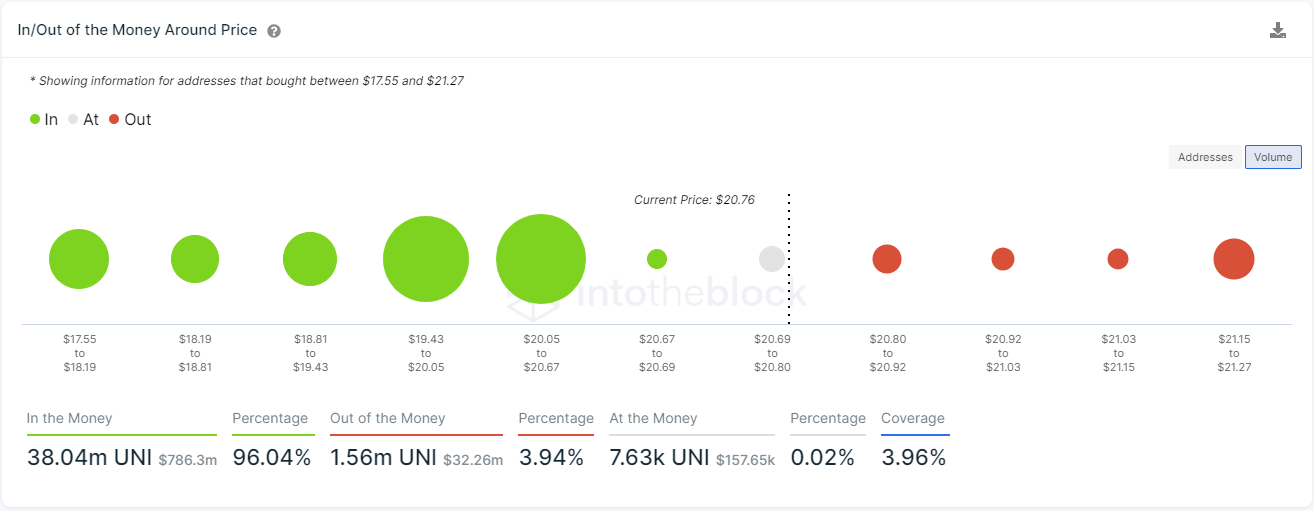
uni price

UNI IOMAP chart

However, the TD Sequential indicator has presented a sell signal on the weekly chart and a green ‘8’ candlestick on the 12-hour chart which will most likely turn into another sell signal as well.
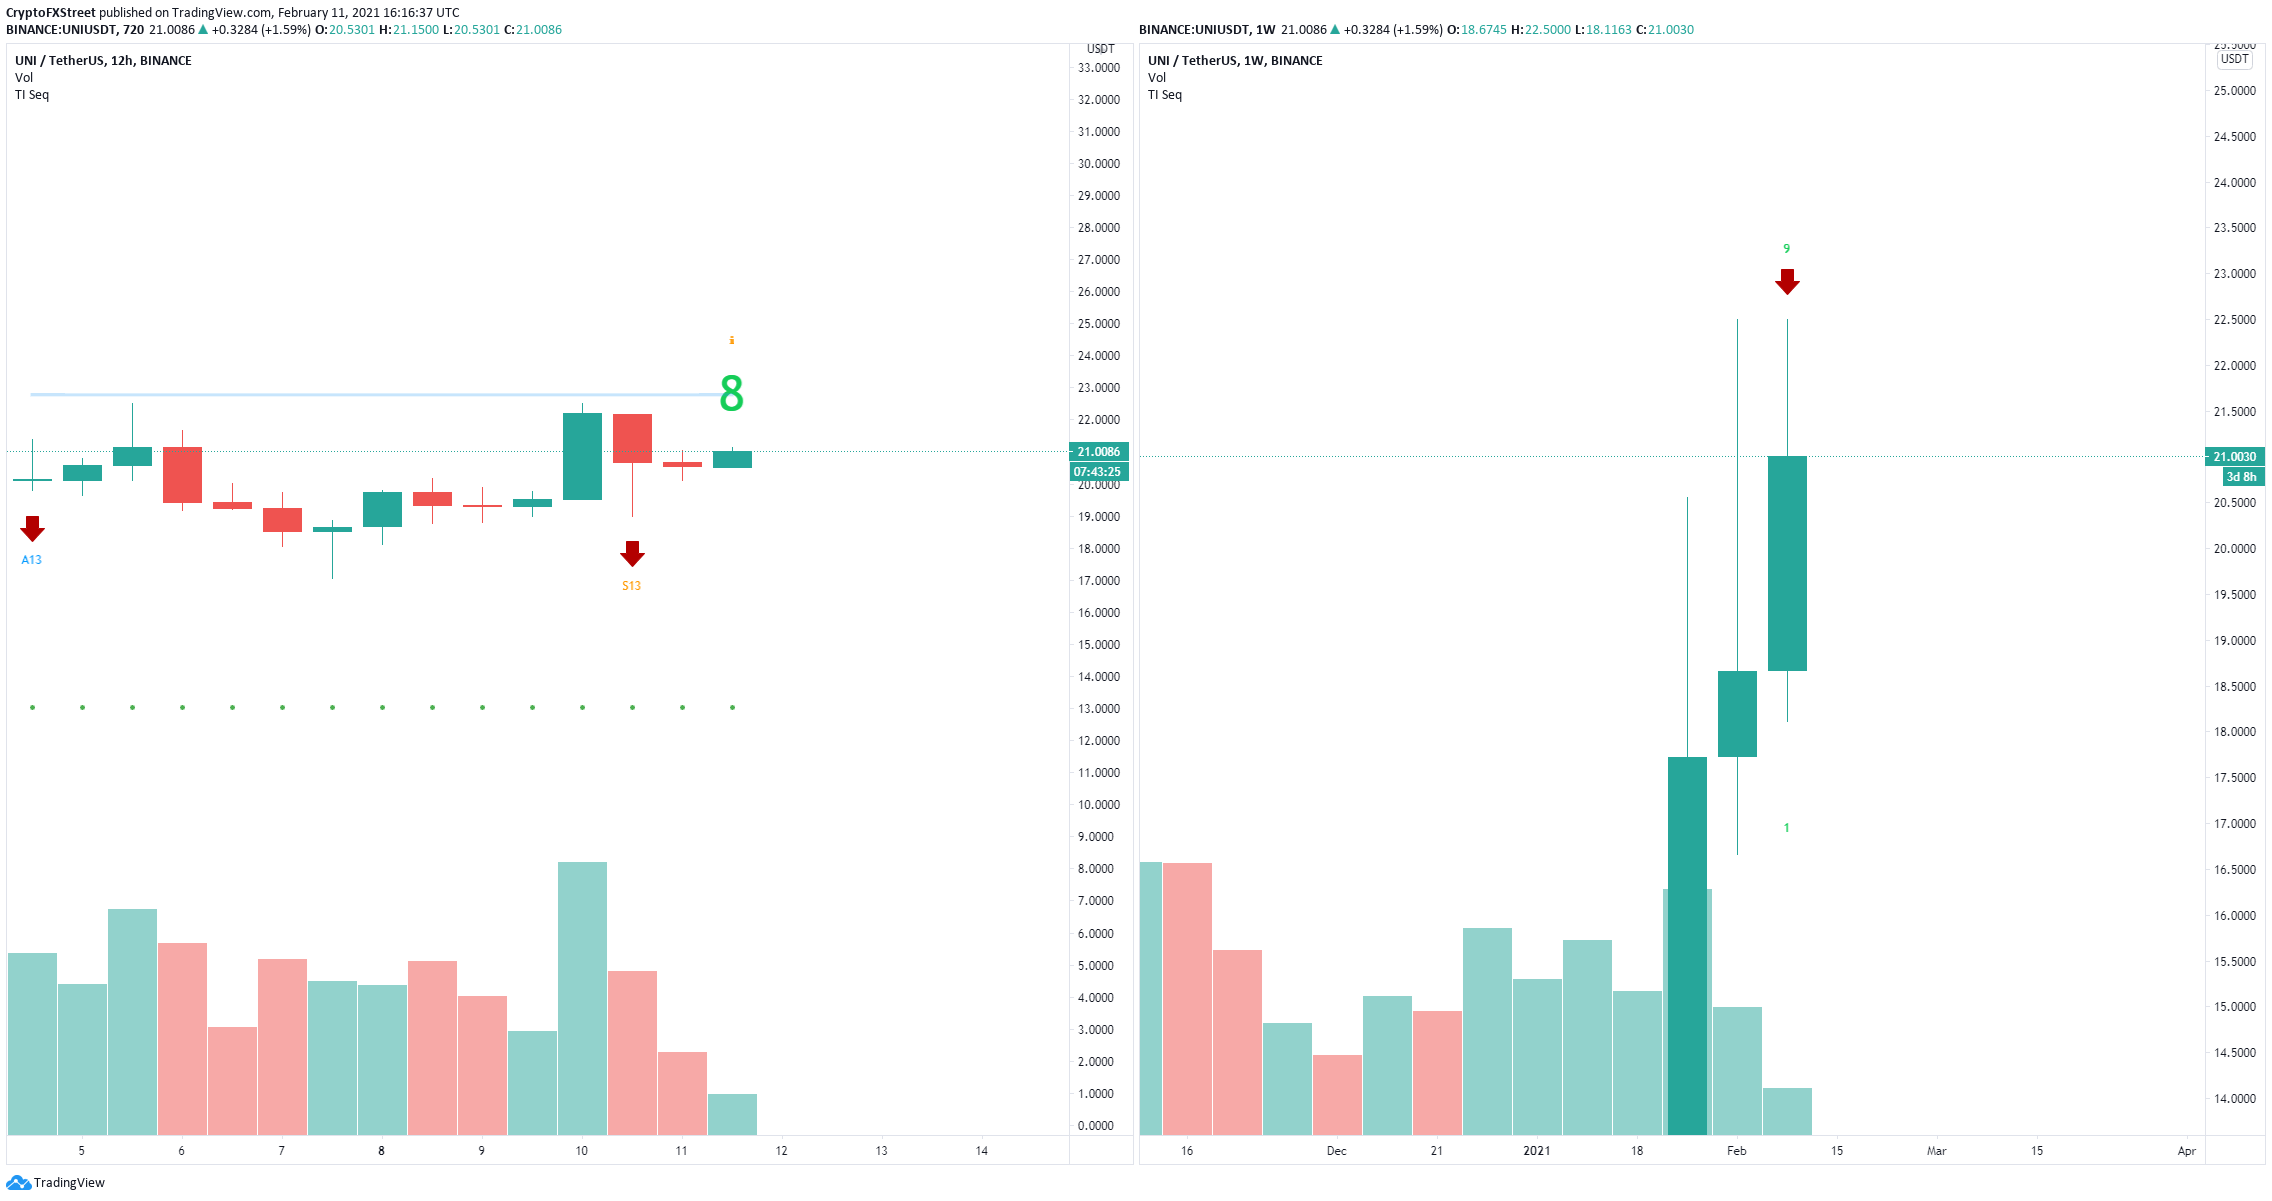
uni price

UNI Sell Signals

The validation of these two sell signals can drive Uniswap price towards the lower trendline of the ascending channel at $19.7. Losing this point would invalidate the bull flag and can push Uniswap price down to $17.6 according to the IOMAP model.

Author

Lorenzo Stroe

Lorenzo Stroe

Independent Analyst

Lorenzo is an experienced Technical Analyst and Content Writer who has been working in the cryptocurrency industry since 2012. He also has a passion for trading.

More from Lorenzo Stroe
Share:

Editor's Picks

Ripple tests recovery strength amid steady ETF inflows, growing retail interest

Ripple (XRP) continues to demonstrate notable resilience as the cryptocurrency market navigates the persistent war in the Middle East after the United States (US) and Israel attacked Iran on Saturday.

Bitcoin extends gains as ETF inflows persist despite broadening US-Iran war

Bitcoin hovers around $73,000 on Thursday, driven by the US Stock market recovery, boosting risk-on sentiment. Data shows analysts are mostly bullish on Bitcoin, citing renewed demand from institutional investors, on-chain holders, and the derivatives market.

Crypto Today: Bitcoin, Ethereum, XRP hold weekly gains despite US-Iran war

The cryptocurrency market is gaining strength on Thursday, building on Wednesday's upswing, which saw Bitcoin reach a weekly high above $74,000. Ethereum and Ripple are moderating their recent gains amid uncertainty stemming from the escalating war in the Middle East.

Pi Network eyes breakout rally as broader market recovers

Pi Network (PI) price extends gains above $0.1900 at press time on Thursday, following a 7% increase the previous day. The upcoming token unlock of more than 20 million PI tokens on Saturday looms over the short-term recovery. 

Bitcoin Price Annual Forecast: BTC holds long-term bullish structure heading into 2026

Bitcoin (BTC) is wrapping up 2025 as one of its most eventful years, defined by unprecedented institutional participation, major regulatory developments, and extreme price volatility.

Bitcoin: Another month of losses, and it’s been five

Bitcoin (BTC) price is stabilizing around $68,000 at the time of writing on Friday, but the Crypto King is poised to close February on a fragile footing, marking its fifth consecutive month of losses since October and a rare start to the year with back-to-back monthly corrections.