Travala Technical Analysis: AVA/USD explodes again with a 50% price surge hitting $2.4
- AVA/USD is up 34% in the last 24 hours and has created a new all-time high.
- Travala is seeing a significant increase in trading volume, although overall is still low.
Travala is now ranked 95th by market capitalization with an $85 million mcap. The digital asset is trading at $2.22 after another massive breakout from $1.63. AVA managed to create a clear daily bull flag that had healthy consolidation and now finally another clear leg up.
AVA/USD daily chart

Considering this is the all-time high for AVA, bulls are not facing many resistance levels to the upside. The RSI is overextended again but will not necessarily pose a threat to AVA in the short-term. The MACD has remained bullish since the initial breakout on July 19.
AVA/USD 4-hour chart
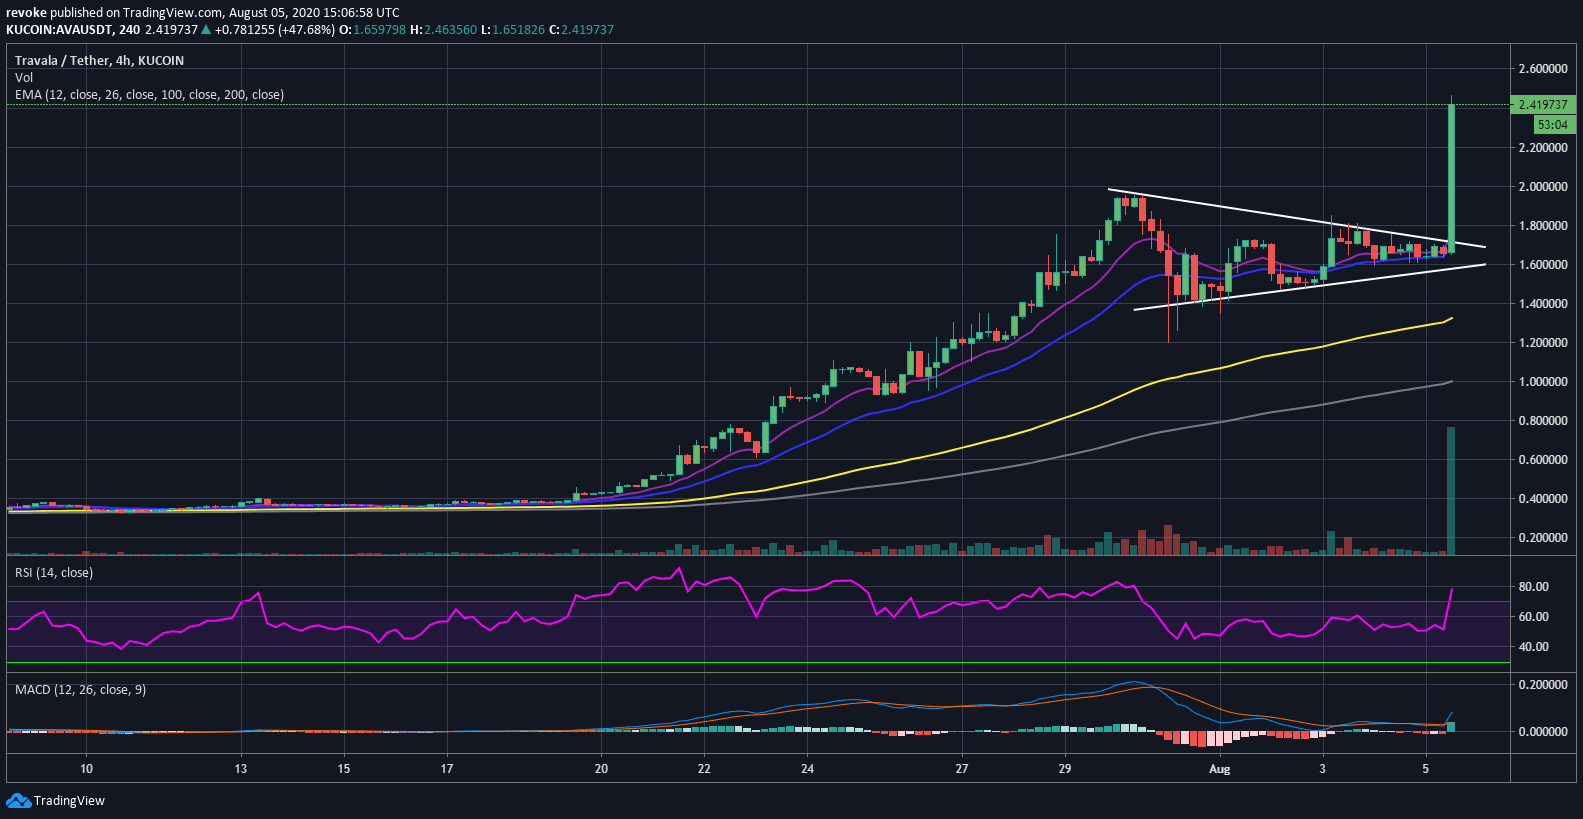
The breakout was a bit more obvious on the 4-hour chart seeing that AVA was trading inside a tightening range.
Author

Lorenzo Stroe
Independent Analyst
Lorenzo is an experienced Technical Analyst and Content Writer who has been working in the cryptocurrency industry since 2012. He also has a passion for trading.


