Top Meme Coins Price Prediction: DOGE, SHIB, PEPE at key resistances, eye breakout gains
- Dogecoin holds over 6% gains from Wednesday, targeting a key short-term resistance level breakout.
- Shiba Inu ticks nearly 1% on the upside, approaching a resistance level intact since mid-June.
- Pepe edges higher by nearly 2% on Thursday, teasing the breakout of a descending triangle pattern.

Meme coins are finding tailwinds supporting their sudden recovery as the broader market gains strength. Dogecoin (DOGE), Shiba Inu (SHIB), and Pepe (PEPE), the top three meme coins by market capitalization, are near key resistance levels on their daily chart. As buyers anticipate a potential breakout rally, the technical outlook holds a cautionary note that meme coins are yet to pass the crossroads.
Dogecoin eyes further gains as momentum shifts
Dogecoin forms a Doji candle at press time on Thursday, indicating an indecisive intraday trend following the 6.91% surge on Wednesday. The intraday indecisiveness reflects a brawl between opposing market forces acting near the short-term resistance at $0.1694, last tested on Sunday.
A potential close above this level could propel Dogecoin towards its June high at $0.2067.
The technical indicators reflect a shift in momentum from bearish to neutral as the Relative Strength Index (RSI) at 47 hovers flat under the halfway line. Still, the Moving Average Convergence/Divergence (MACD) indicator displays the MACD and signal lines yet to flip positive despite a rising trend since June 27.
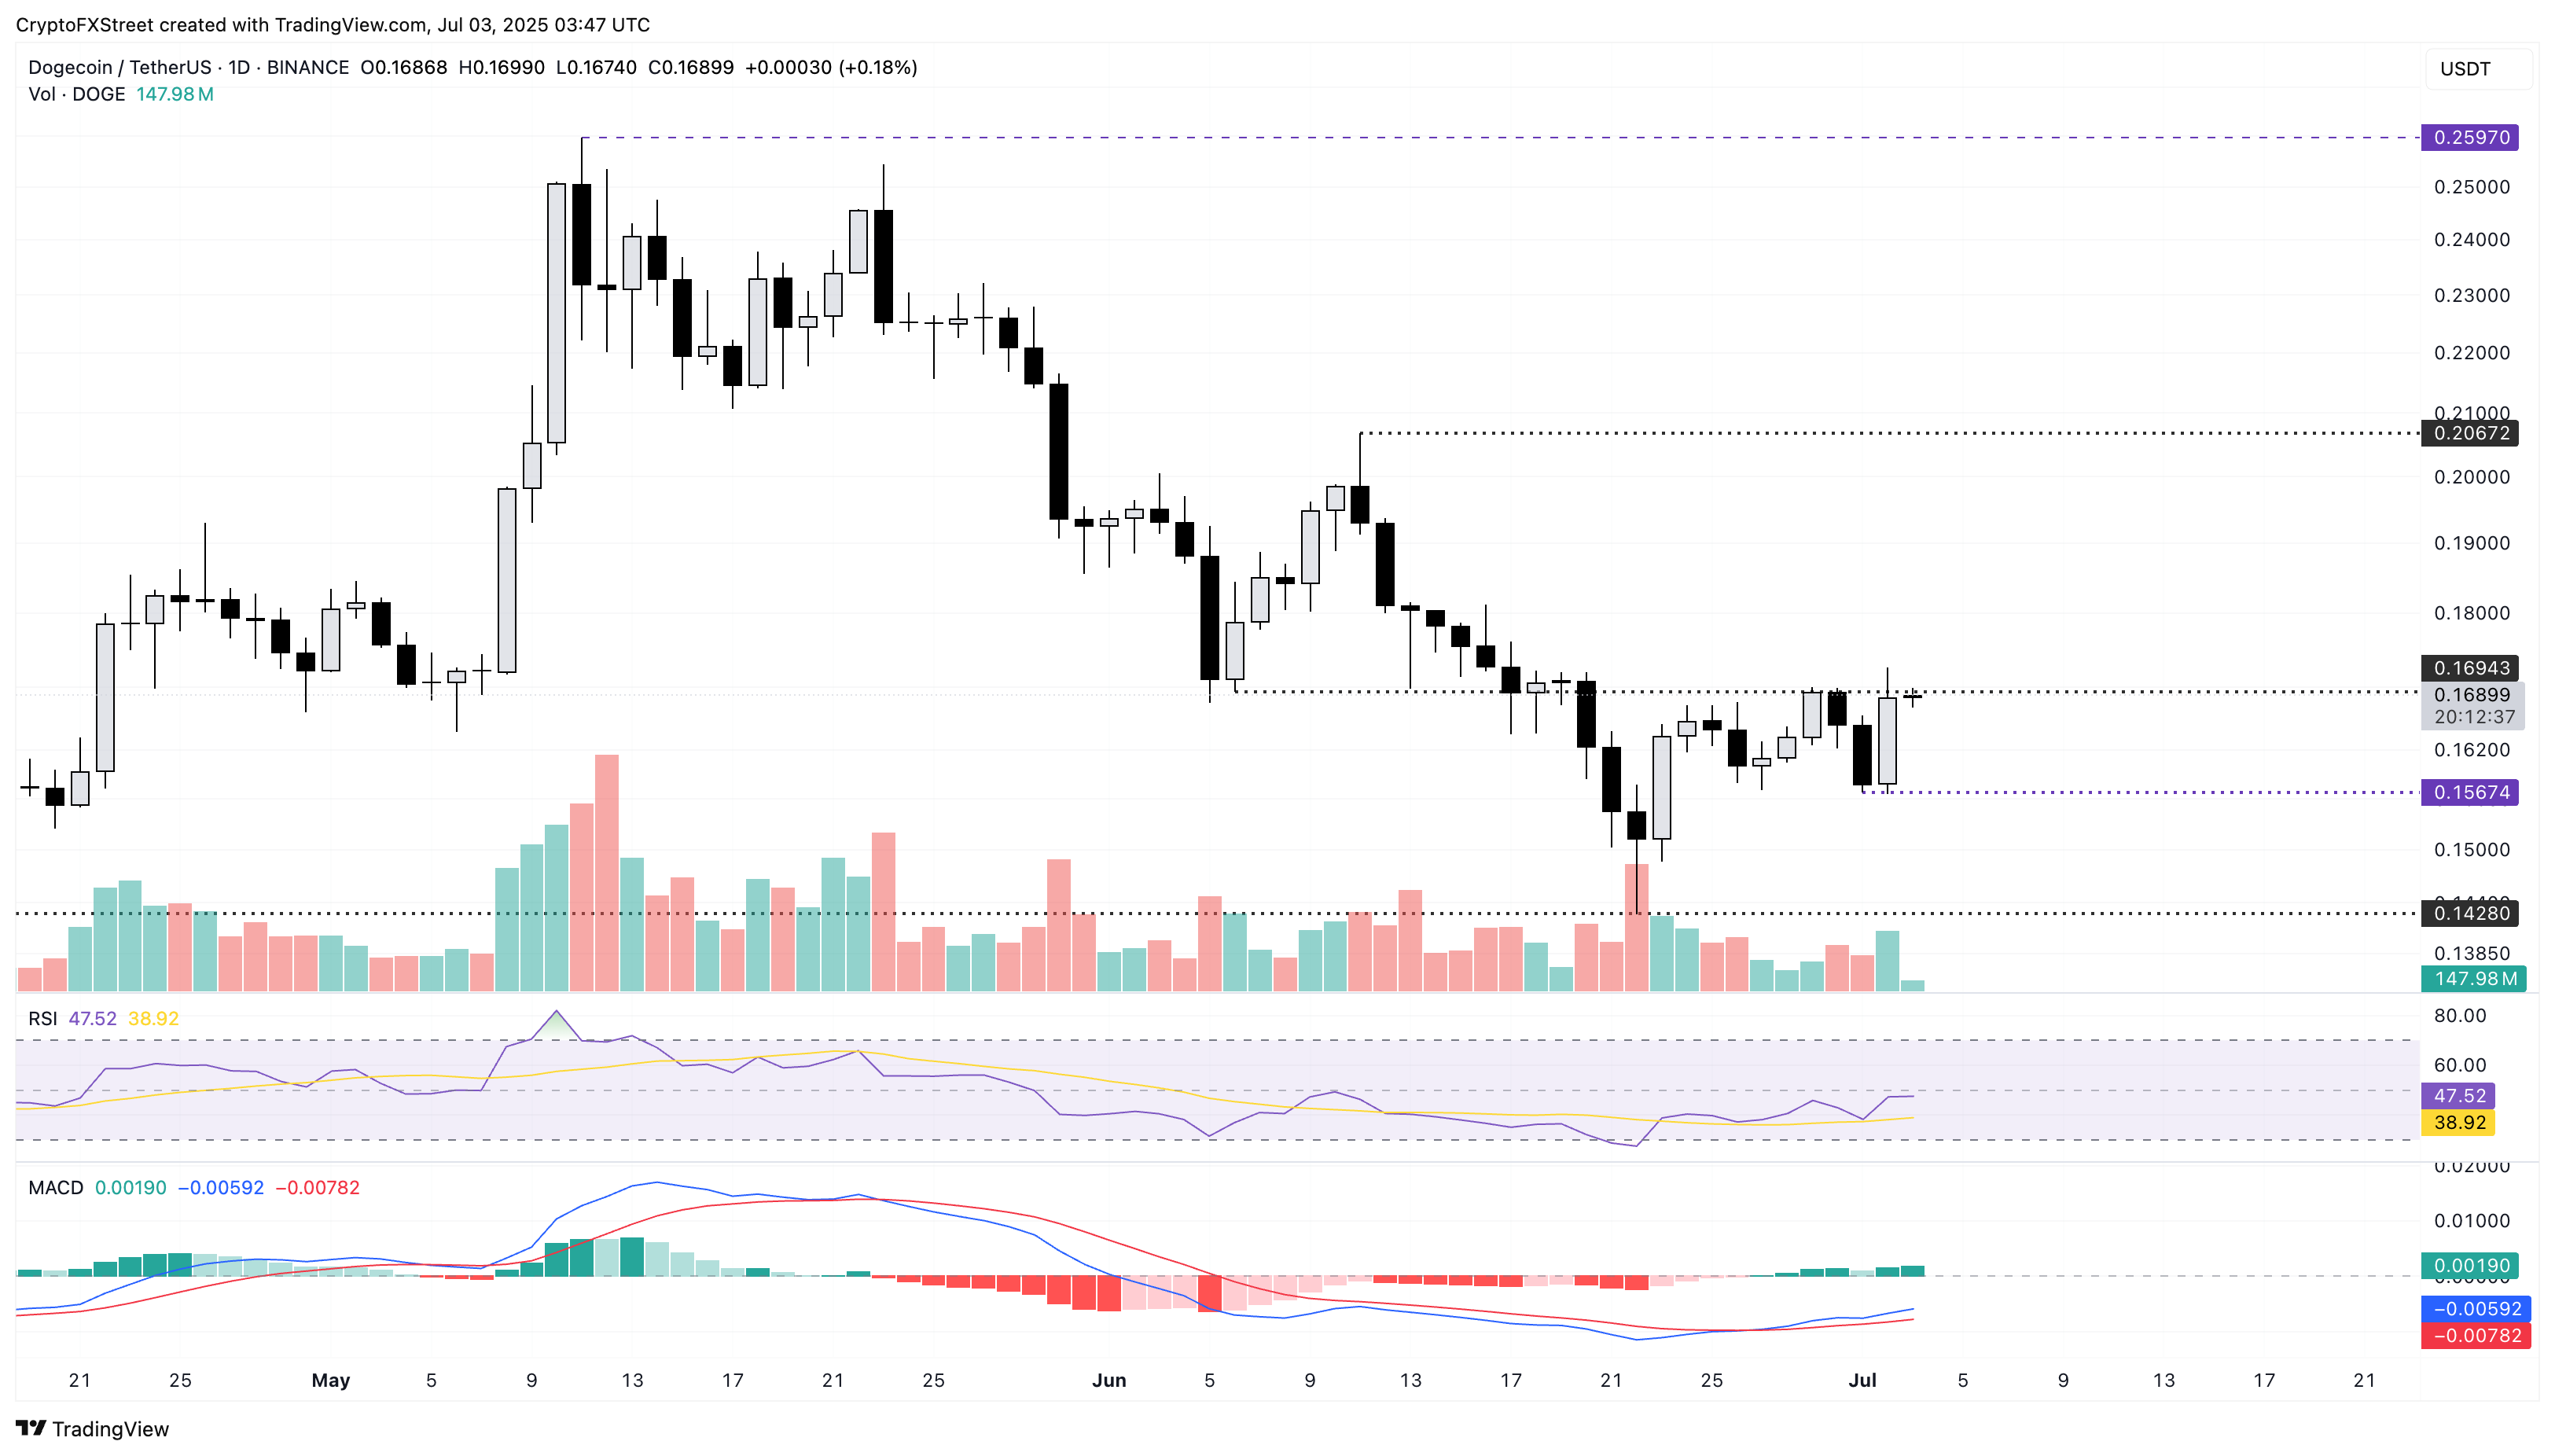
DOGE/USDT daily price chart.
The reversal chances for DOGE could increase if it forms a Doji or a bearish candle on Thursday. In such a scenario, it could retest Tuesday’s low at $0.1567, undermining the bullish engulfing candle on Wednesday.
Shiba Inu approaches a crucial crossroads
Shiba Inu edges higher by nearly 1% at the time of writing on Thursday, adding gains over the 5.45% rise from the previous day. To extend the uptrend, SHIB must surpass the $0.00001200 resistance level, which was previously tested on Wednesday and Sunday.
A decisive close above this level could extend the recovery towards the June 10 closing price at $0.00001335.
The technical indicators reflect a minor recovery in trend momentum as the RSI at 49, pointing higher, aims to surpass the 50 midpoint level. Further, the MACD indicator and its signal line triggered a crossover on June 25 and continue to rise towards the zero line.
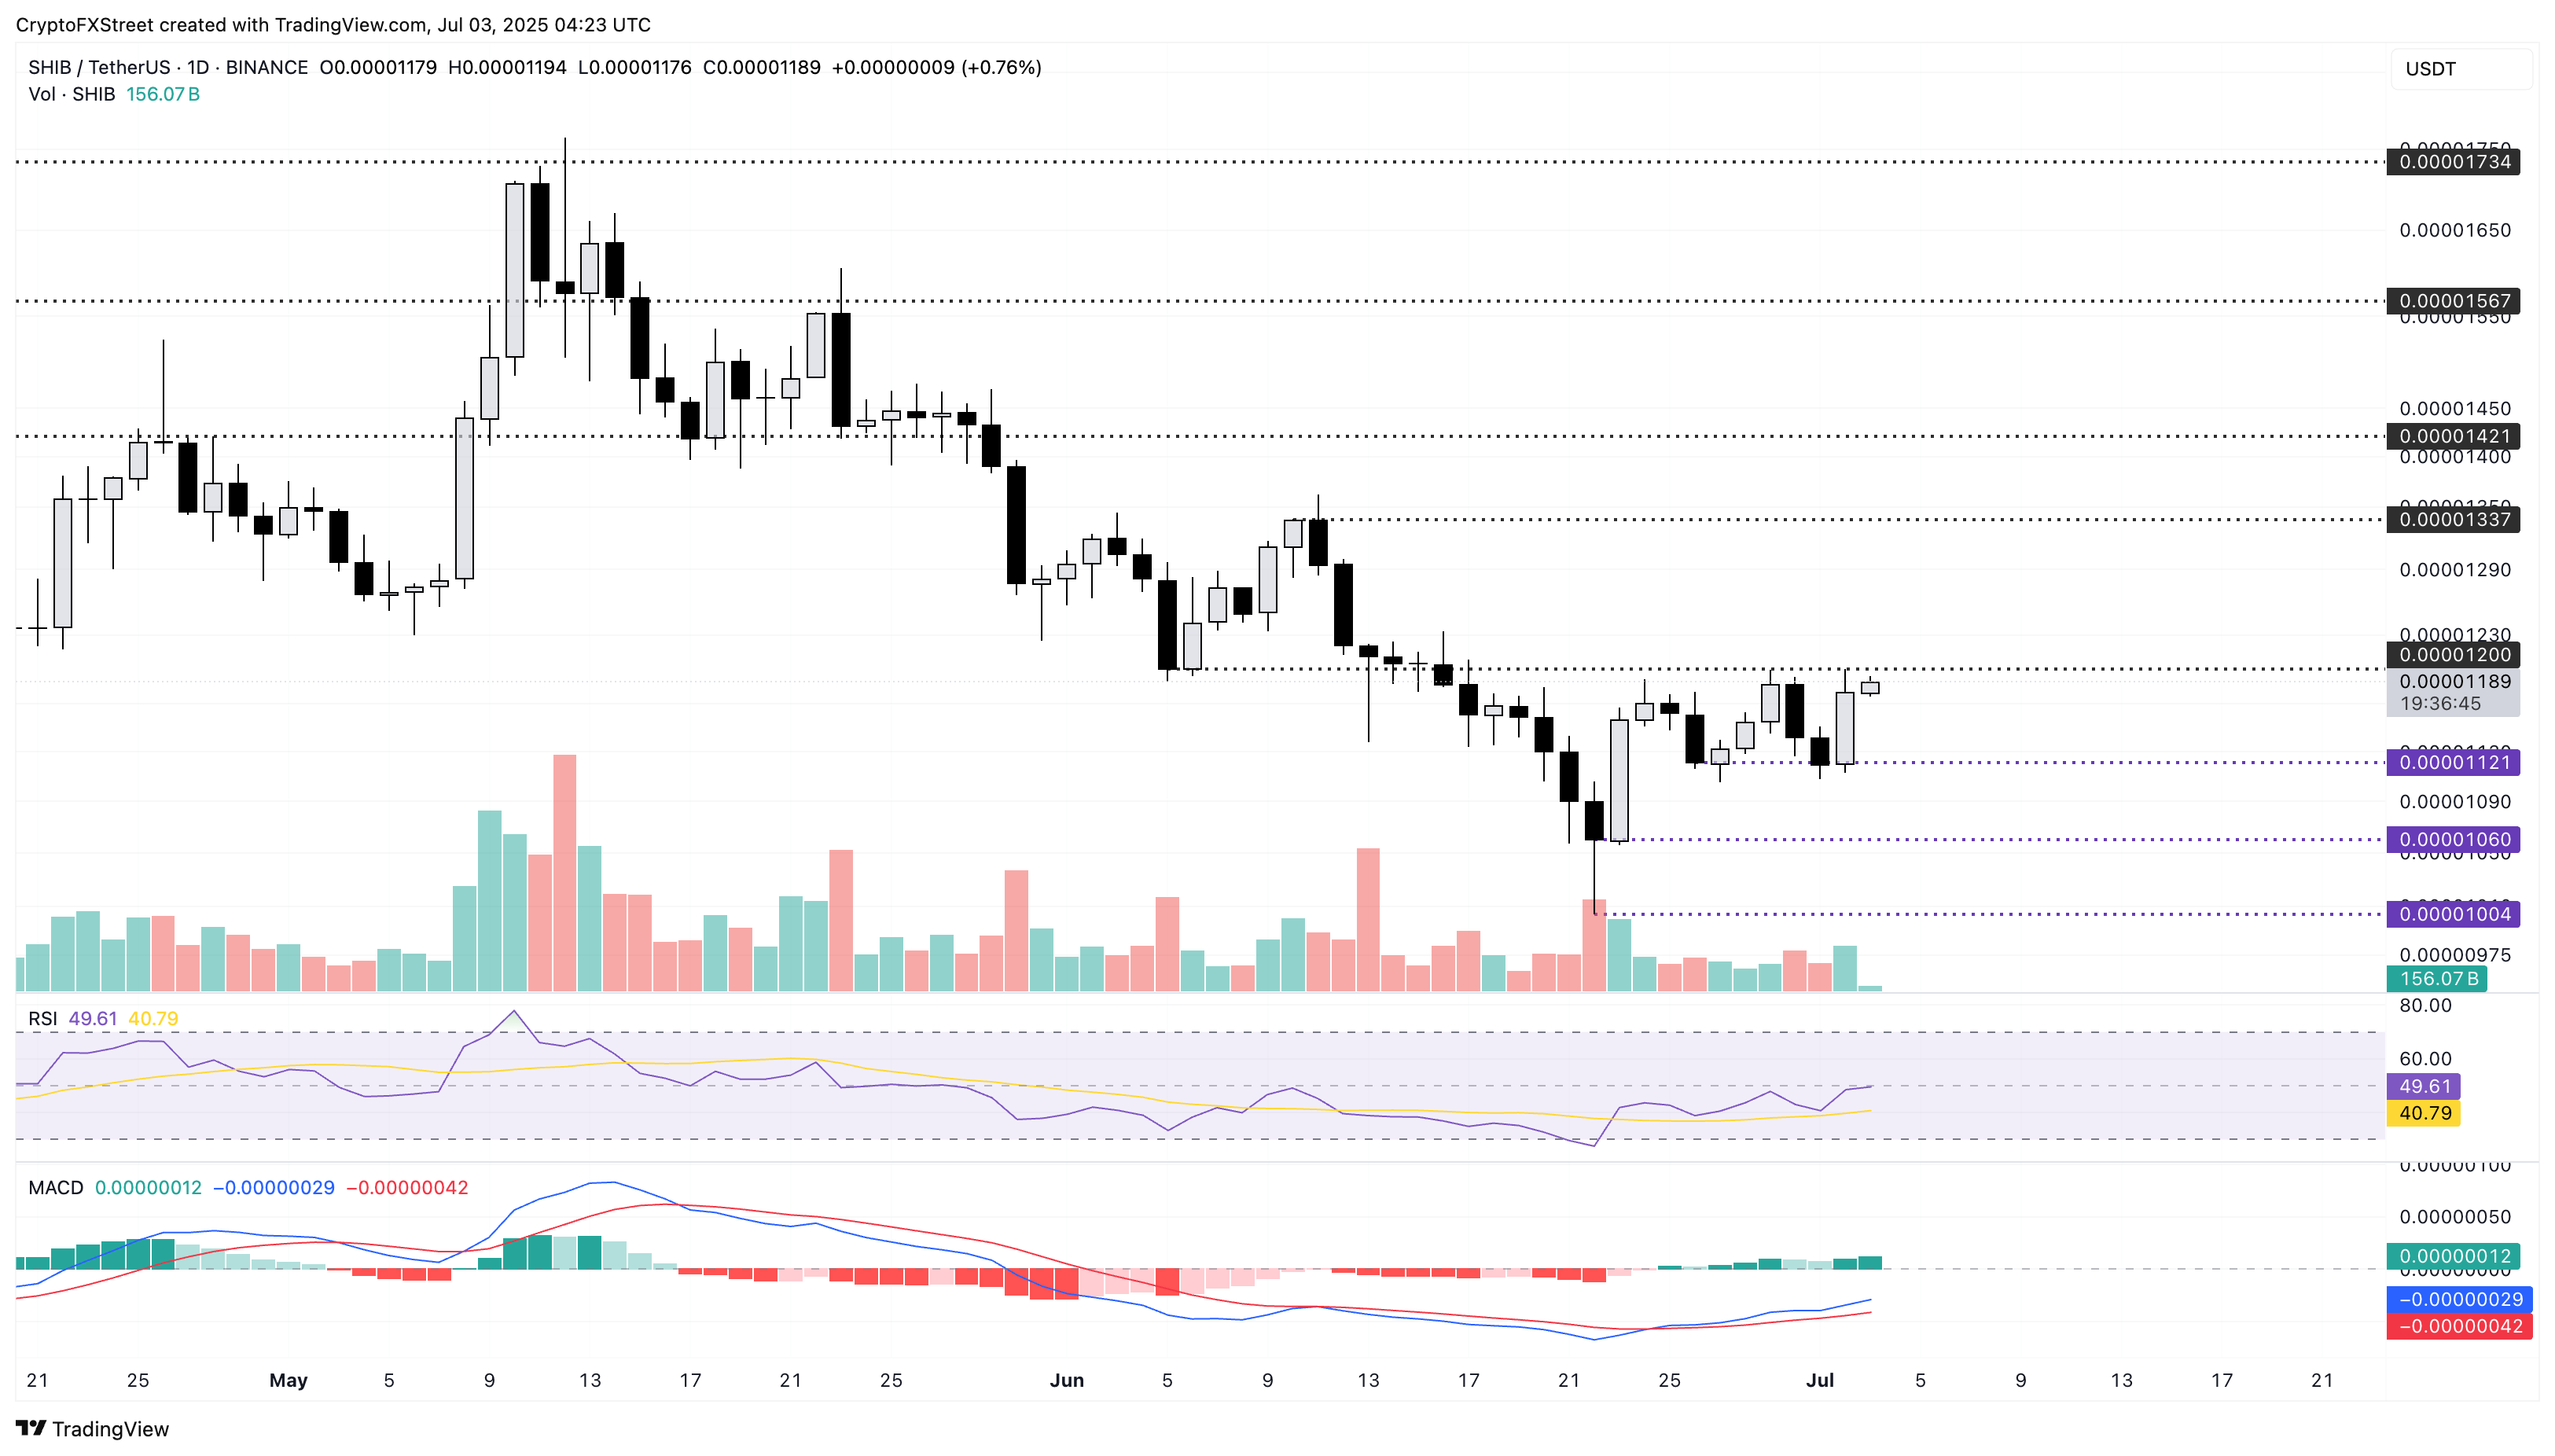
SHIB/USDT daily price chart.
On the contrary, a reversal from the $0.00001200 resistance level could test the $0.00001121 support level, last tested on Tuesday.
Pepe nears breaking out of a descending triangle pattern
PEPE trades in the green by nearly 2% at press time on Thursday, holding above the $0.00001000 psychological support level. The meme coin trades above a local resistance trendline formed by connecting the May 23 high and June 10 close.
The trendline completes a descending triangle with a base support at $0.00000900. A potential close above this trendline would ignite a descending triangle pattern breakout rally. However, to reinforce the uptrend, PEPE must close above the $0.00001037 resistance level last tested on Wednesday.
The PEPE breakout rally could target the $0.00001196 level last tested on June 8.
The technical indicators back the optimism as the RSI recovers to 49 from the oversold region. In contrast, the MACD indicator displays an uptrend in the average lines following the crossover on Sunday.
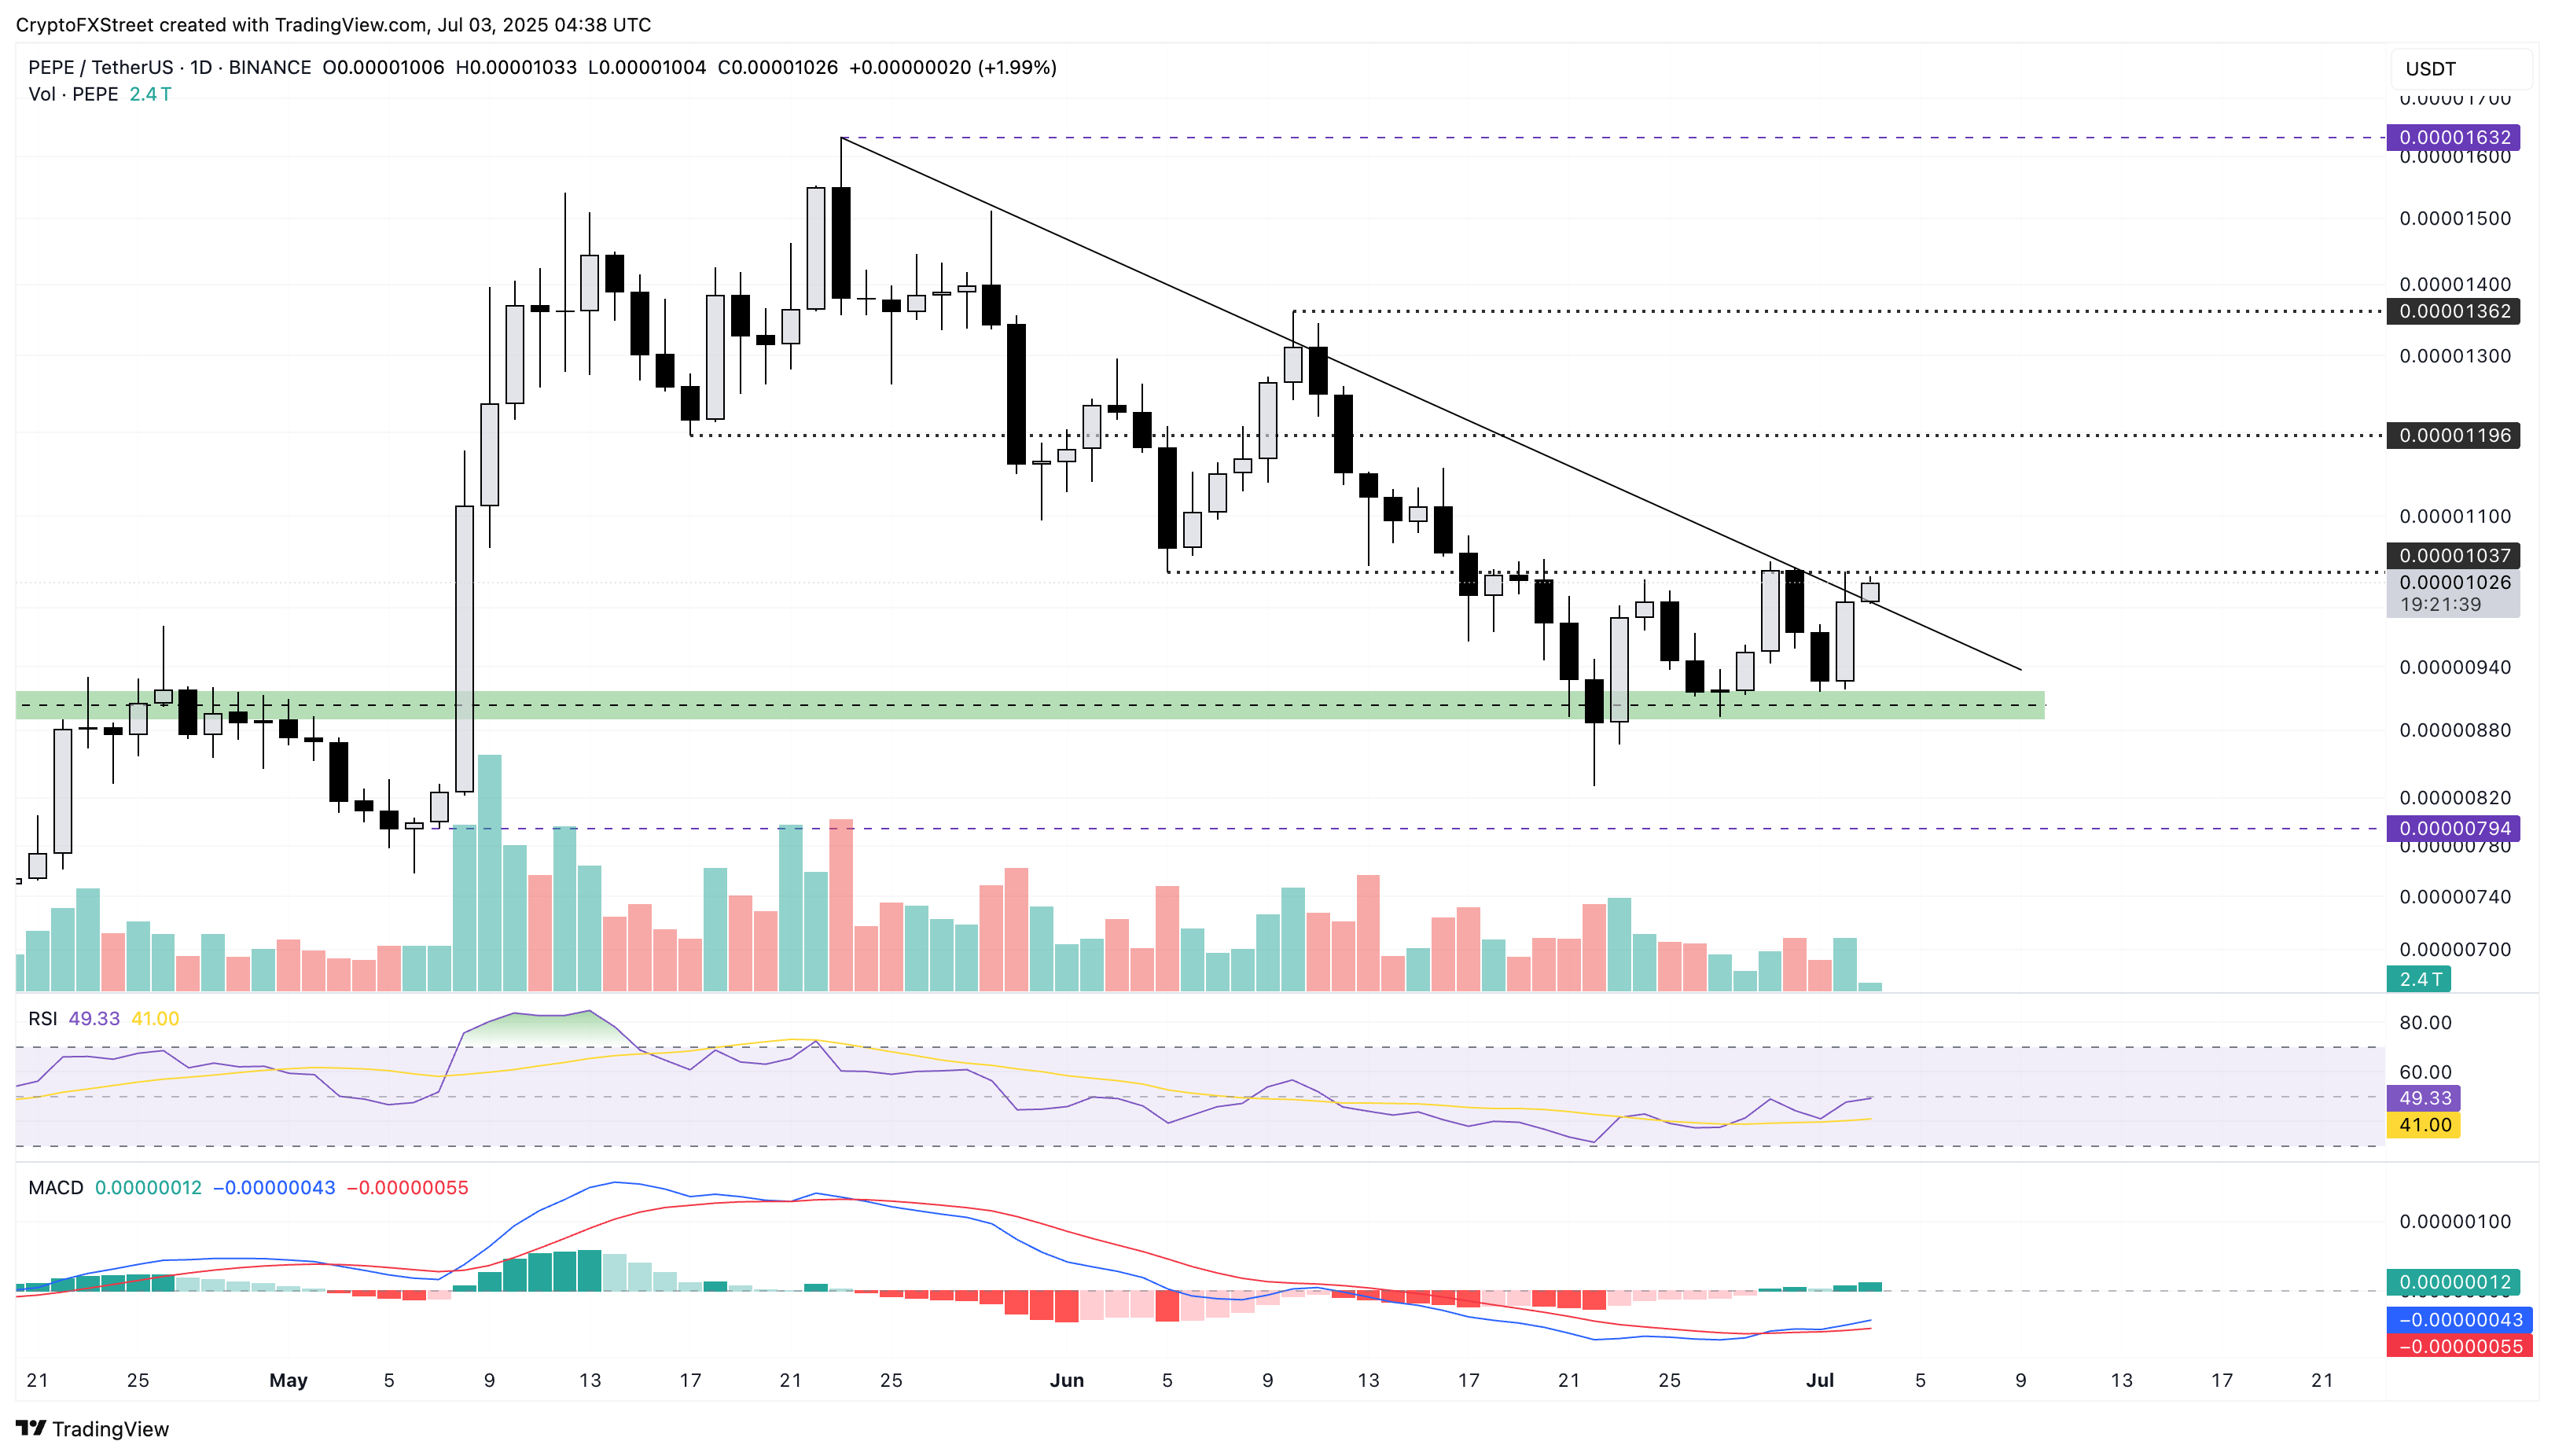
PEPE/USDT daily price chart.
On the contrary, a bearish close to the day could plunge PEPE towards the base support of $0.00000900.
Author

Vishal Dixit
FXStreet
Vishal Dixit holds a B.Sc. in Chemistry from Wilson College but found his true calling in the world of crypto.


