Top Crypto Gainers: SPX, MNT, INJ put a strong start to the week
- SPX leads the market recovery with double-digit gains over the last 24 hours.
- Mantle hits a fresh record high, putting pressure on the local resistance trendline.
- Injective moves closer to the apex of a symmetrical triangle pattern on the daily chart.

SPX6900 (SPX), Mantle (MNT), and Injective (INJ) rise as top performers in the broader cryptocurrency market over the last 24 hours. SPX and MNT look for further gains amid a high momentum rally, while INJ remains trapped in a symmetrical triangle pattern.
SPX6900 channel breakout rally gains momentum
SPX edges higher by almost 1% at press time on Monday, extending the uptrend for the sixth consecutive day. The meme coin’s rally also marks a breakout from a falling channel pattern on the daily chart, influencing a bullish cross in the 50-day and 100-day Exponential Moving Averages (EMAs), signaling a stronger short-term recovery.
The SPX rally approaches the 1.272 Fibonacci extension level at $1.6950, drawn from the $1.4804 peak from September 17 to the $0.9000 low from Tuesday. A clean push above this level could further stretch the rally to the 1.618 Fibonacci extension level at $2.0135.
The technical indicators on the daily chart maintain a bullish bias as the Relative Strength Index (RSI) at 66 shows elevated buying pressure. Additionally, the Moving Average Convergence Divergence (MACD) crosses above the zero line with its signal line following suit, indicating a rise in bullish momentum.
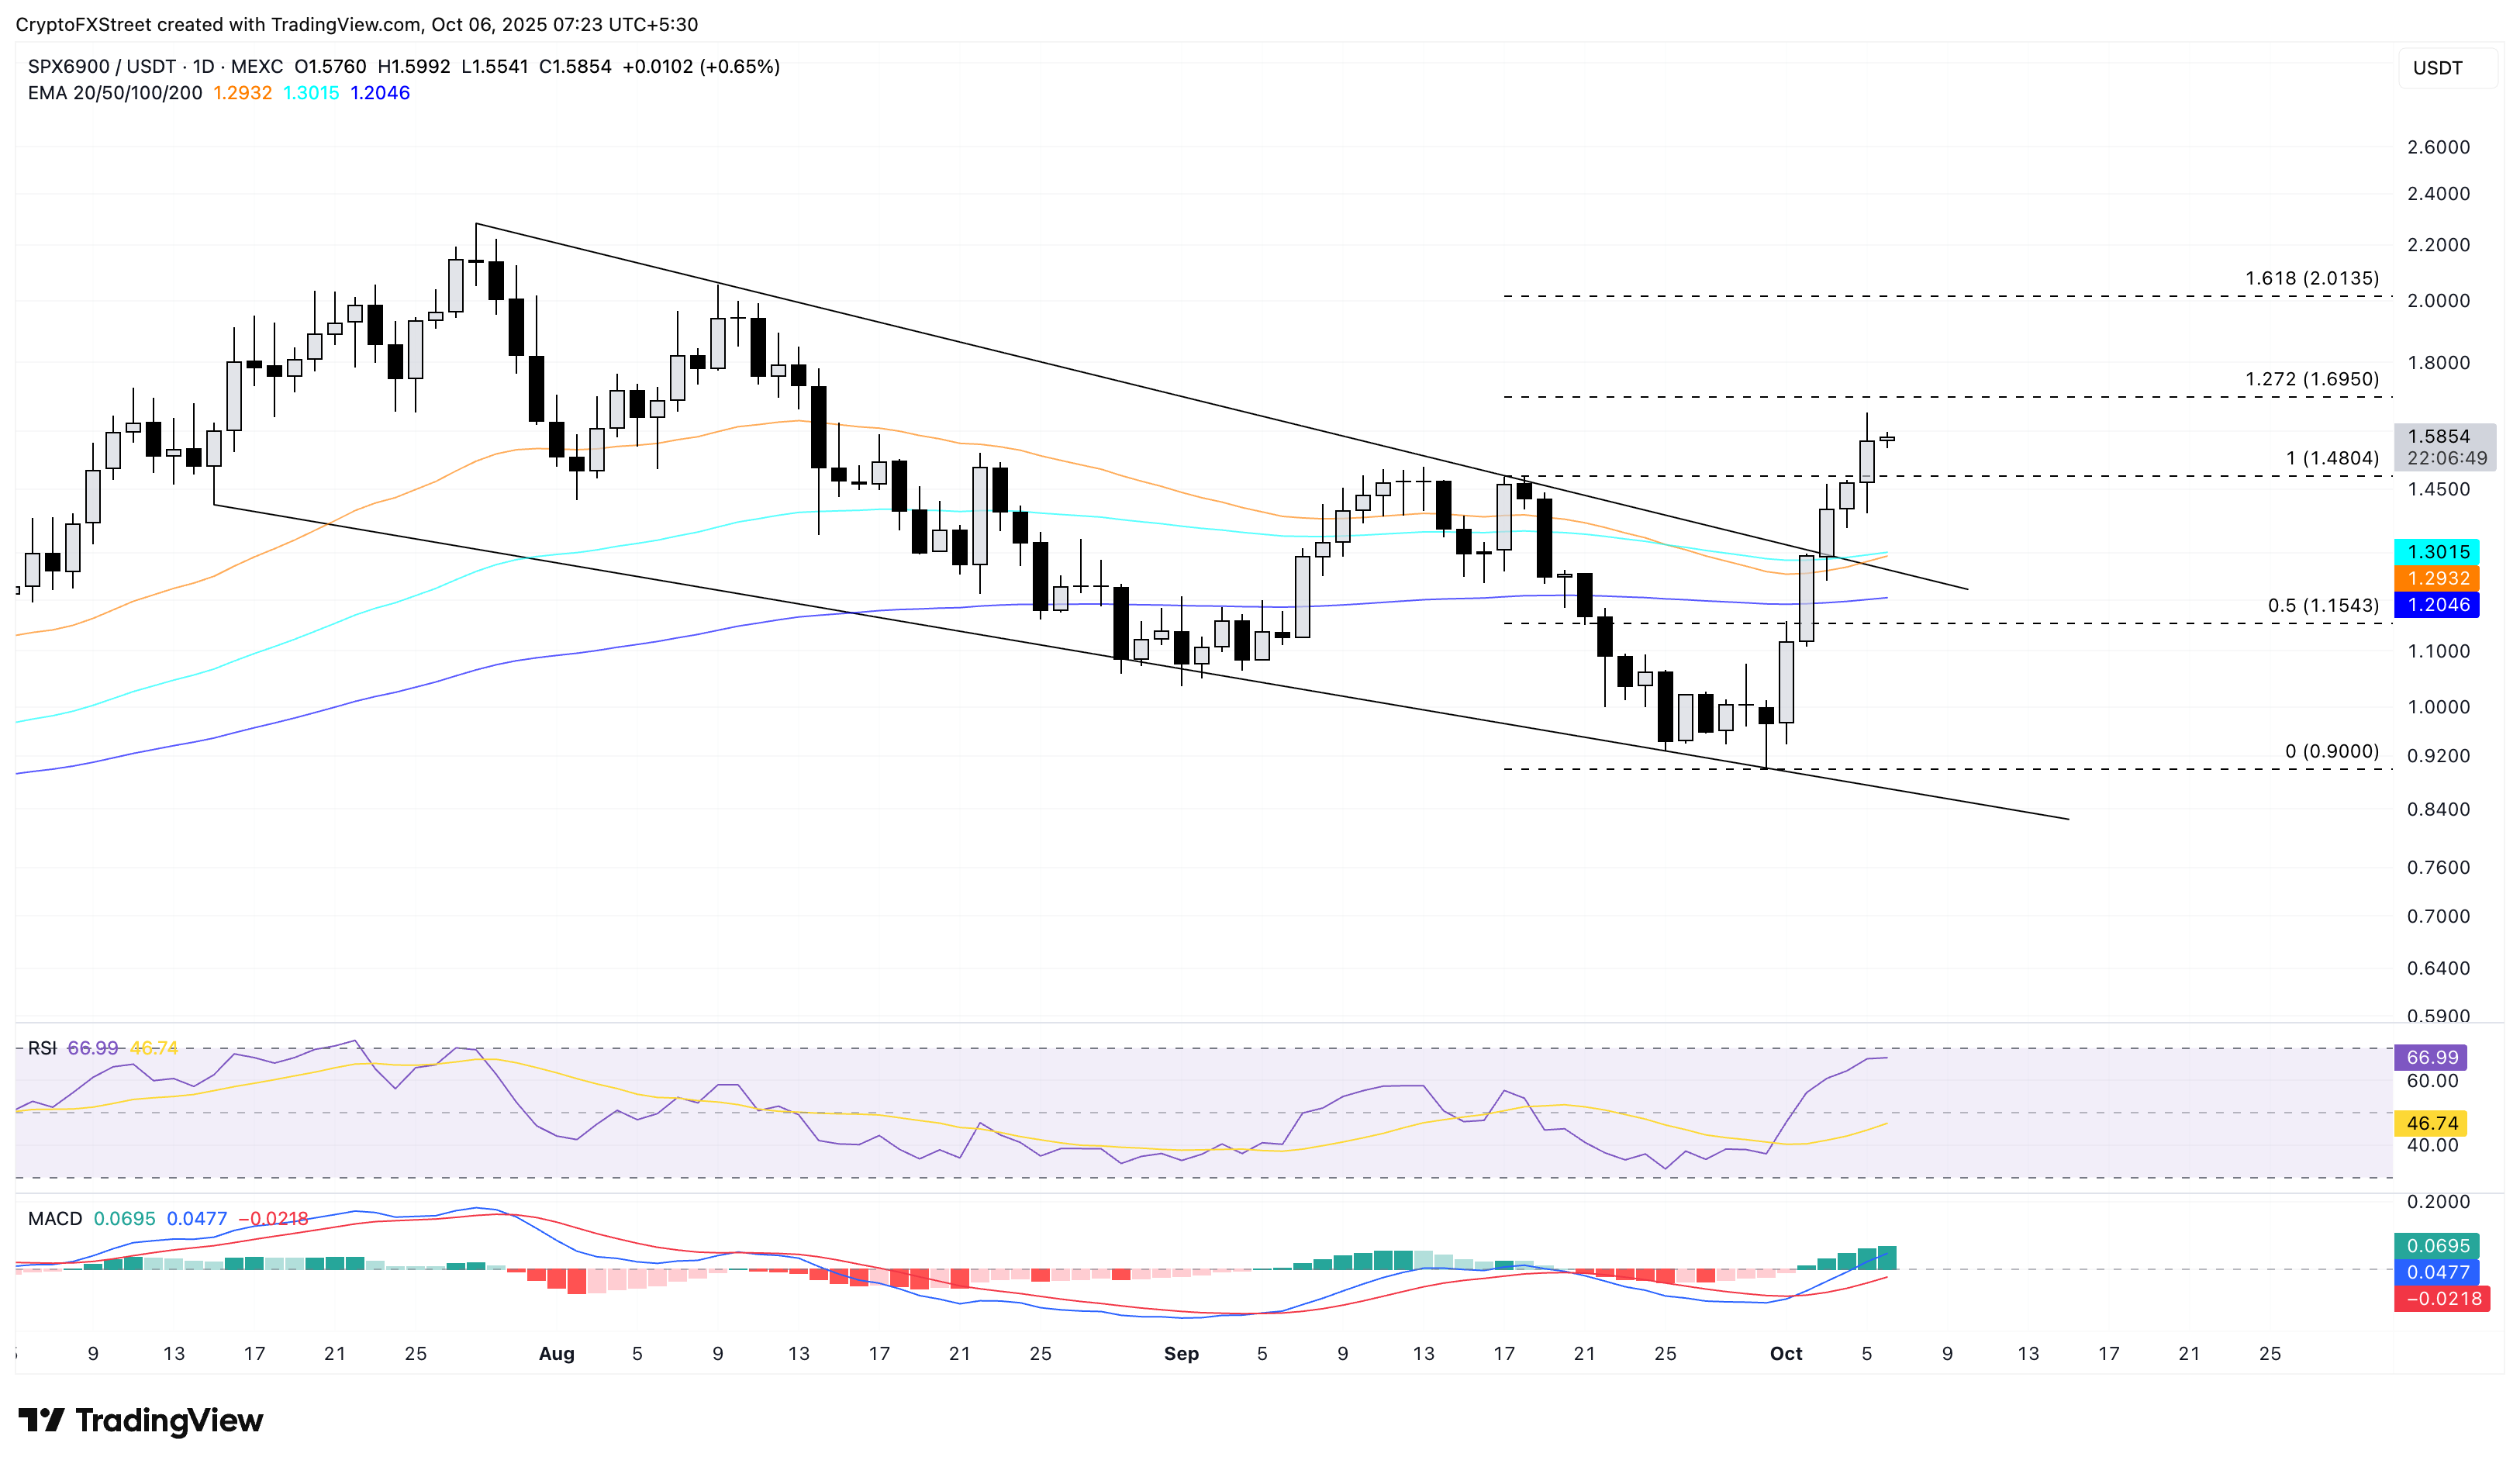
SPX/USDT daily price chart.
On the other hand, a potential reversal in the SPX could retest the resistance-turned-support level of $1.4804.
Mantle rally eyes further gains
Mantle trades at a fresh record-high of over $2.00 following the nearly 8% gains from Sunday. At the time of writing, the MNT price is up by 1%, challenging the overhead resistance trendline of a rising wedge on the daily chart.
Typically, a rising wedge pattern results in a downside reversal, but the breakout of the resistance trendline could invalidate the pattern. A decisive close above the trendline at $2.15 would further extend the uptrend, confirming the breakout to the upside.
The RSI is at 68 on the daily chart, extending the sideways movement below the overbought zone as buying pressure remains stable. Moreover, the MACD sloping upwards from its signal line indicates a revival in bullish momentum.
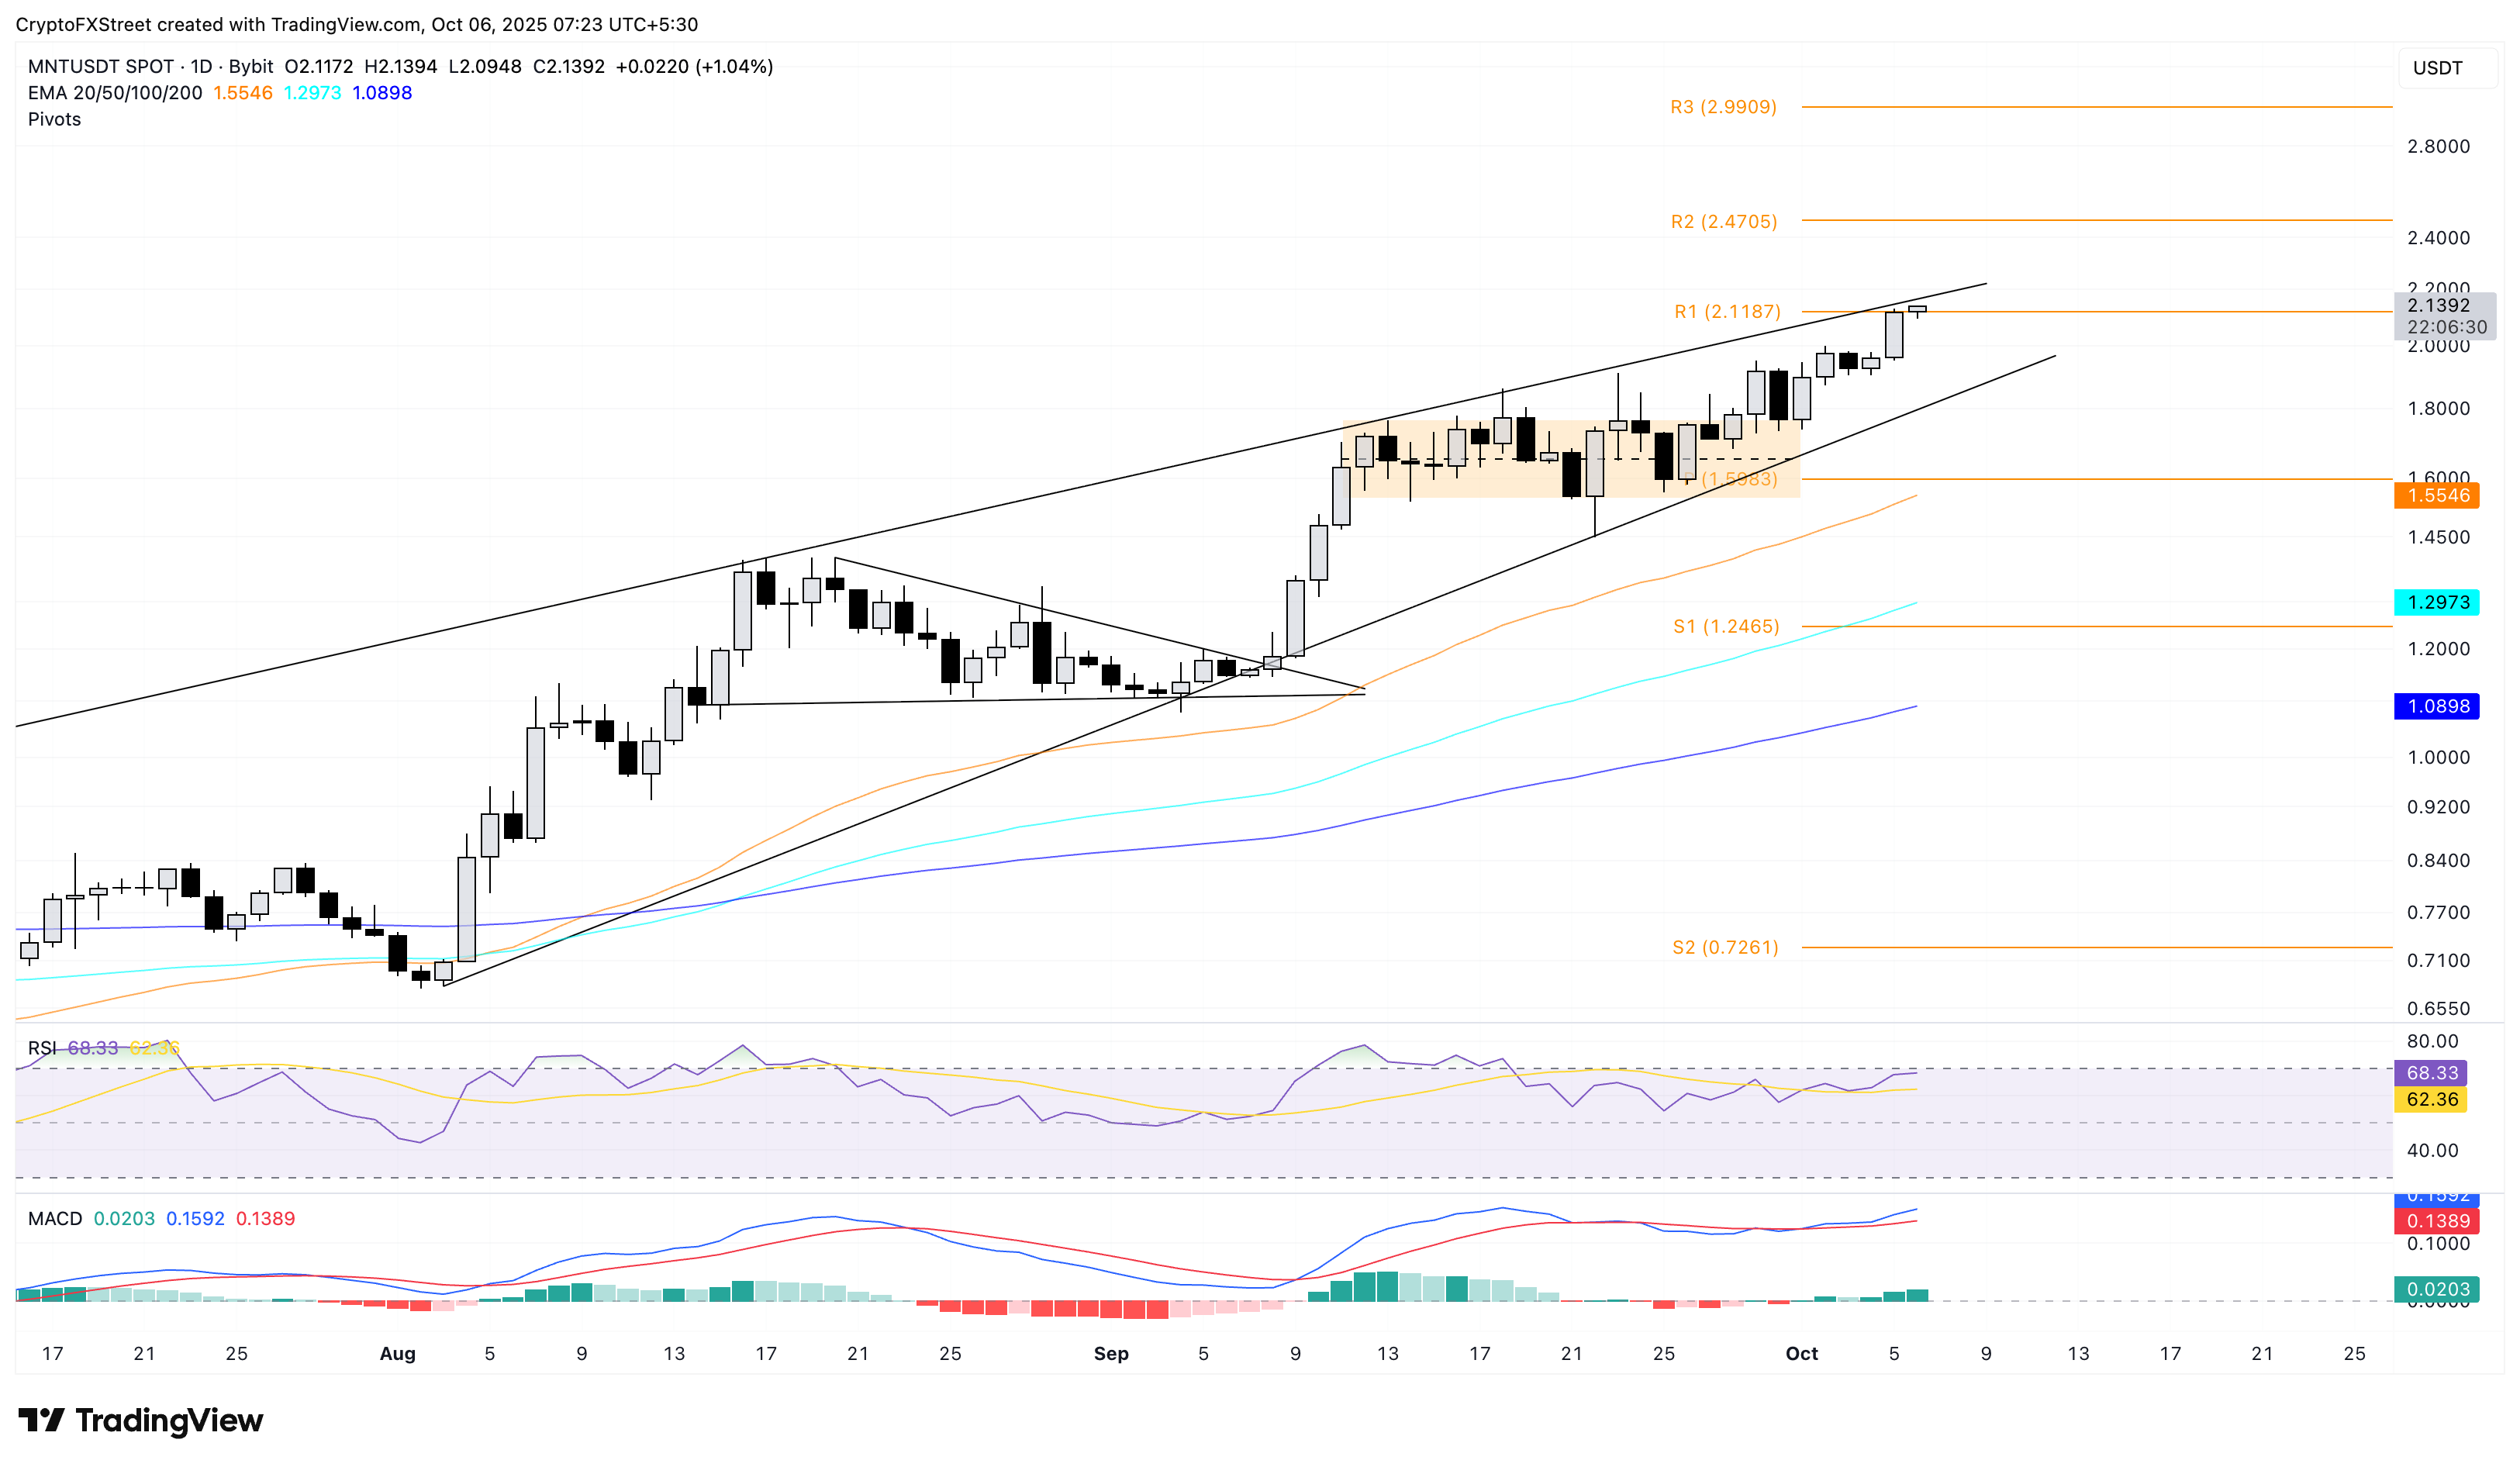
MNT/USDT daily price chart.
Still, if MNT reverses from the overhead trendline, it would signal a downcycle within the rising wedge, potentially testing the support trendline at $1.85.
Injective recovery hits the 200-day EMA
Injective extends the 1% gain from Sunday by over 5% at press time on Monday, marking a bullish start to the week. The short-term recovery struggles to surpass the 200-day EMA at $13.55.
If INJ surpasses this dynamic resistance, it could test the resistance trendline of a symmetrical triangle pattern on the daily chart at $14.20. Still, a potential triangle pattern rally could face opposition at the 50% retracement level from the $35.26 peak from December 6 to the $6.34 low from April 7, at $14.95.
The RSI, at 52, points upwards after crossing the halfway line, indicating a renewed buying spree. Meanwhile, the MACD holds a steady trend above its signal line after a crossover on Thursday.
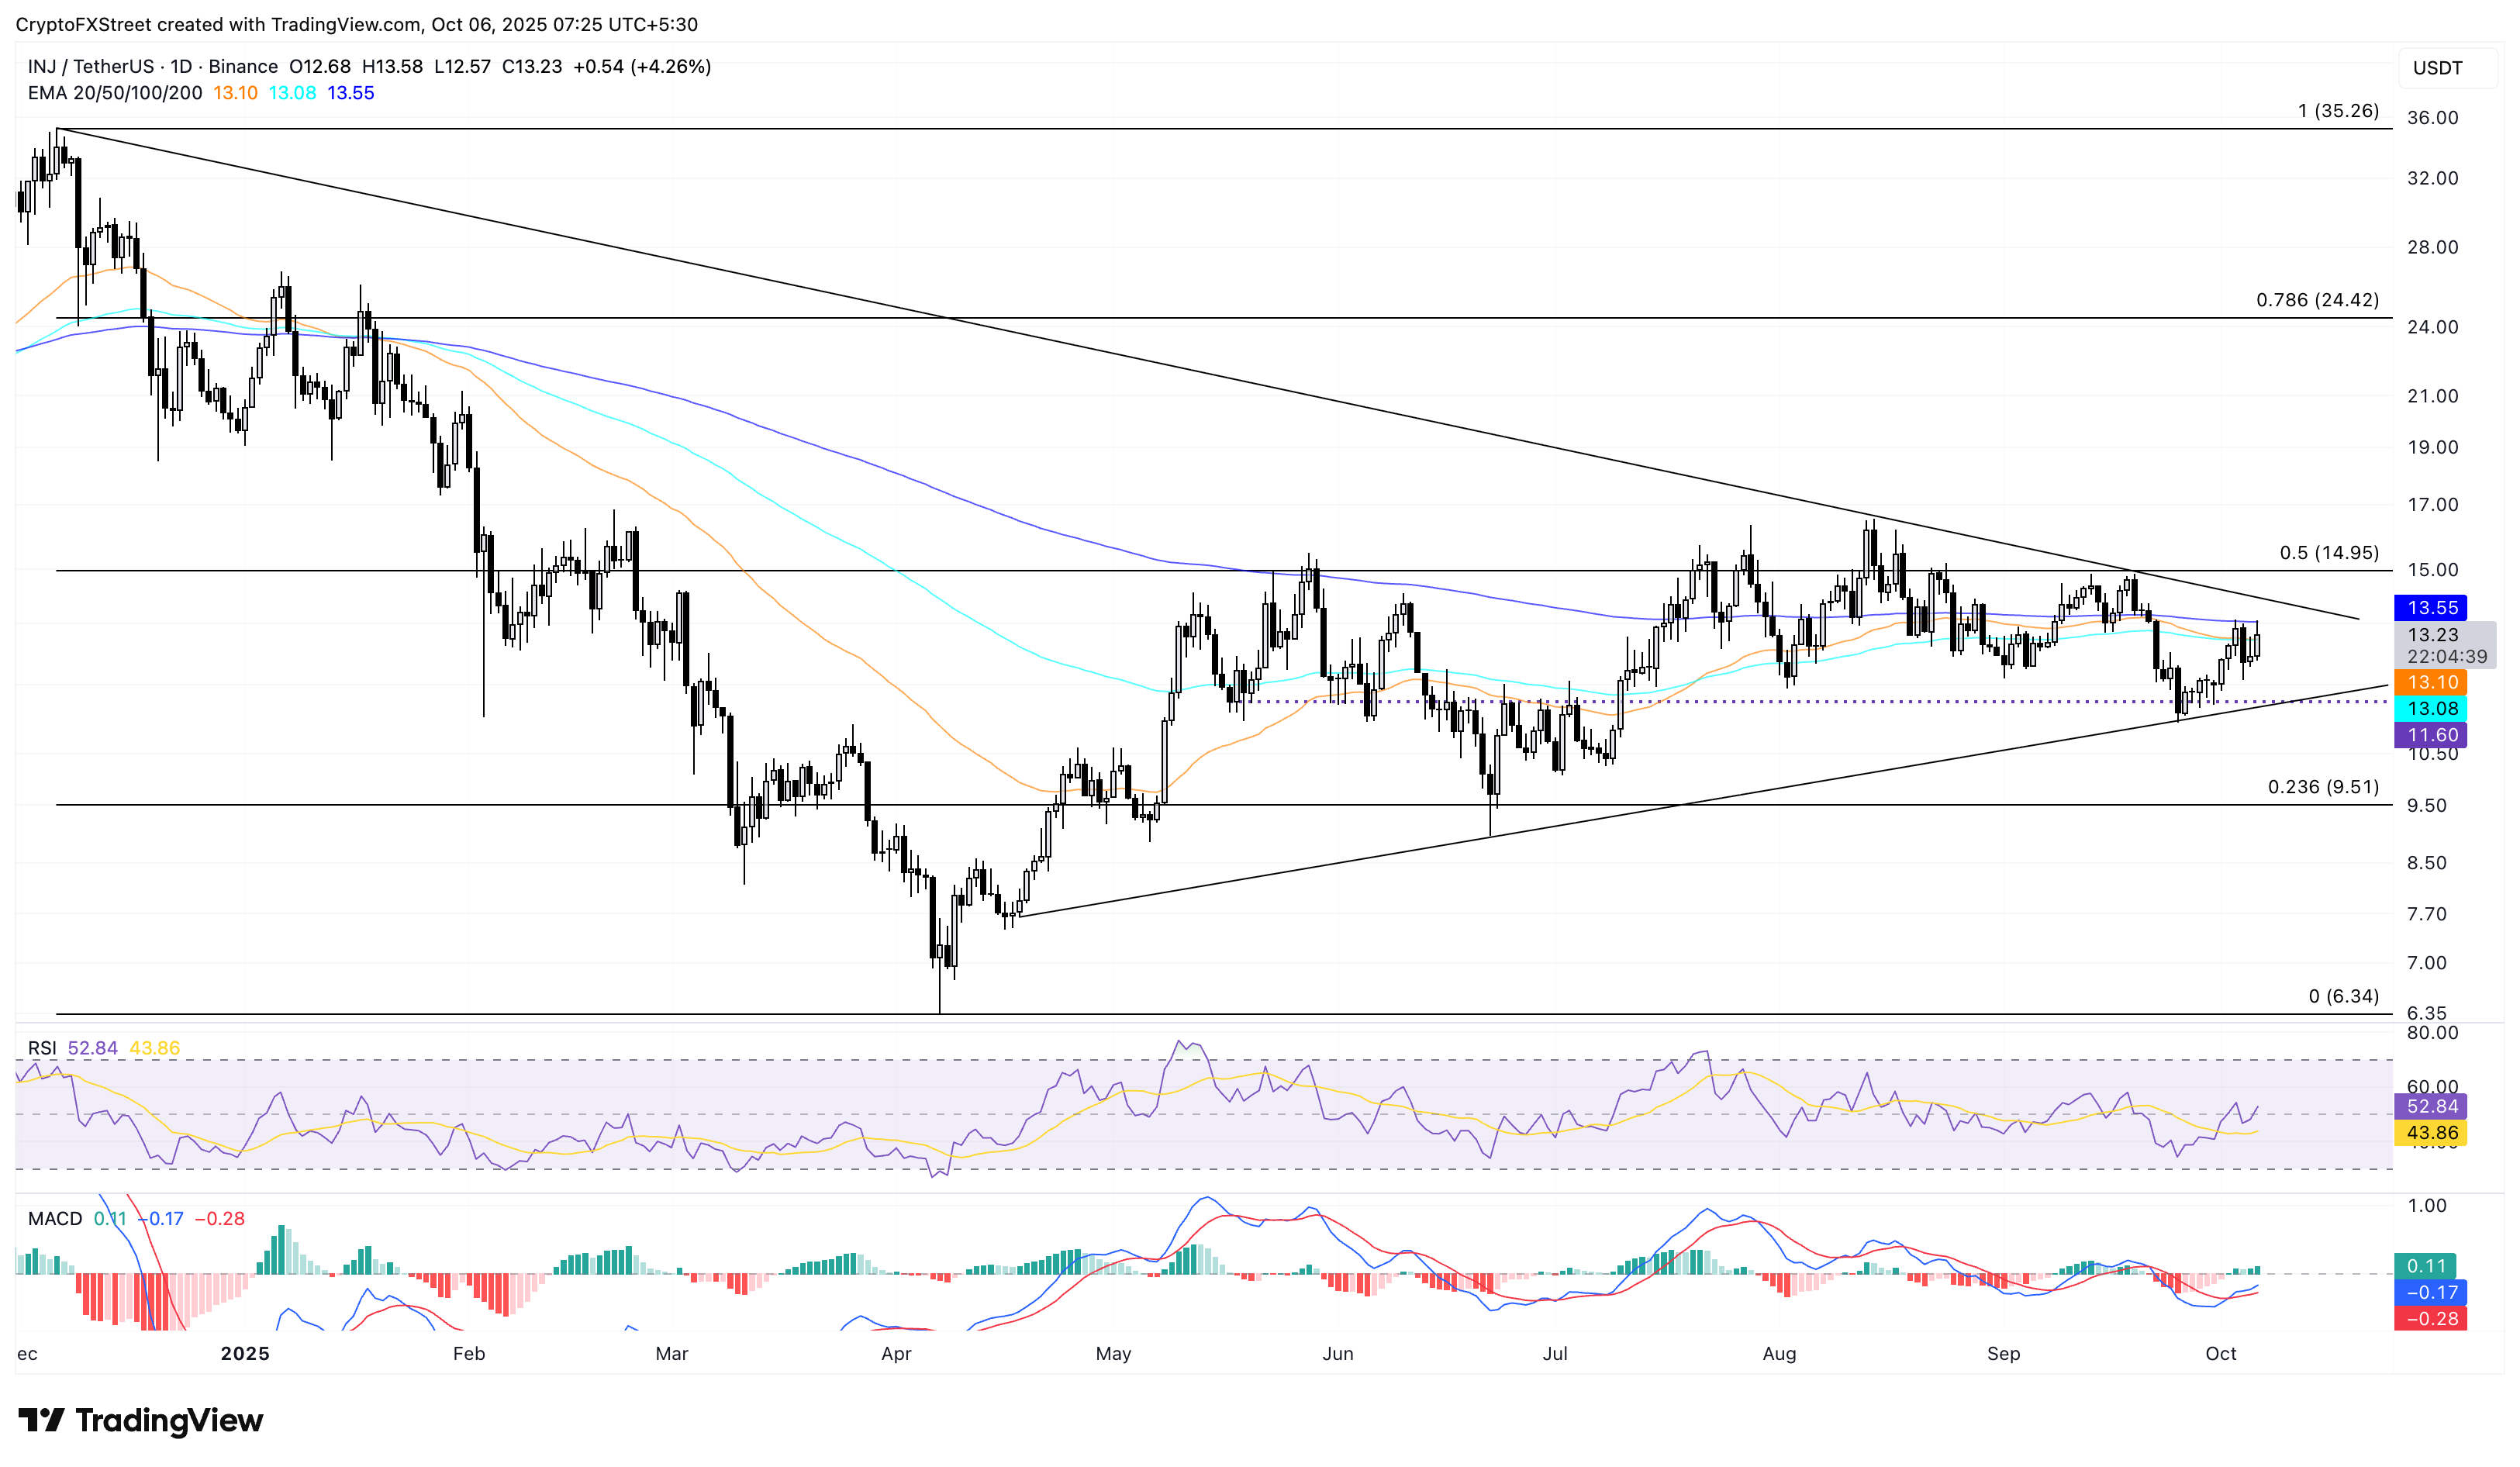
INJ/USDT daily price chart.
Looking down, a reversal from the 200-day EMA could retest the support trendline near $11.60.
Author

Vishal Dixit
FXStreet
Vishal Dixit holds a B.Sc. in Chemistry from Wilson College but found his true calling in the world of crypto.


