Top 3 - Ripple, Bitcoin and Ethereum price predictions: fast short-term analysis
- XRP/USD is accelerating its falls and now reaches the main support at $0.6550
- BTC/USD confirms the technical formation but still needs to respect the $8700 level during the day to avoid bigger damage

The main Cryptocurrencies are nearing critical levels to their mid-term outlook after a week dominated by the bears. Ripple has been the most damaged, with its chart now showing a critical situation.
We will use daily charts today to focus on the mid-term outlook of the Crypto assets analyzed.
XRP/USD daily chart
-636616336488826395.png)
Ripple is accelerating the falls suffered during the last days. XRP/USD is drilling supports, moving averages and trend lines in big sell-off. Despite this movement, that might be getting into the skin of lots of Ripple holders, the daily chart indicators still don't show a panic situation and still keep a rather positive than negative outlook.
If Ripple loses the current level, it's difficult to see anymore supports until $0.55, with very few margin for the bulls, as the only remaining meaningful support would be at $0.4554, a relative low before getting into current year lows territory. On the upside, all the lost levels are now resistances. They are located at $0.713, $0.7365, $0.7639 and $0.80.
MACD in the Ripple daily chart is trading above the 0 line and indicated that the current outlook is still positive for the price action. This indicator is crossed to the downside, very close to the mid-point, with a probable change of direction.
Directional Movement Index in the same chart shows the sellers increasing strongly their activity and spiking. It's interesting to note that the ADX is not showing any acceleration in the last bearish leg. Sellers are losing ground but still not showing the lowest levels seen on March lows.
BTC/USD daily chart
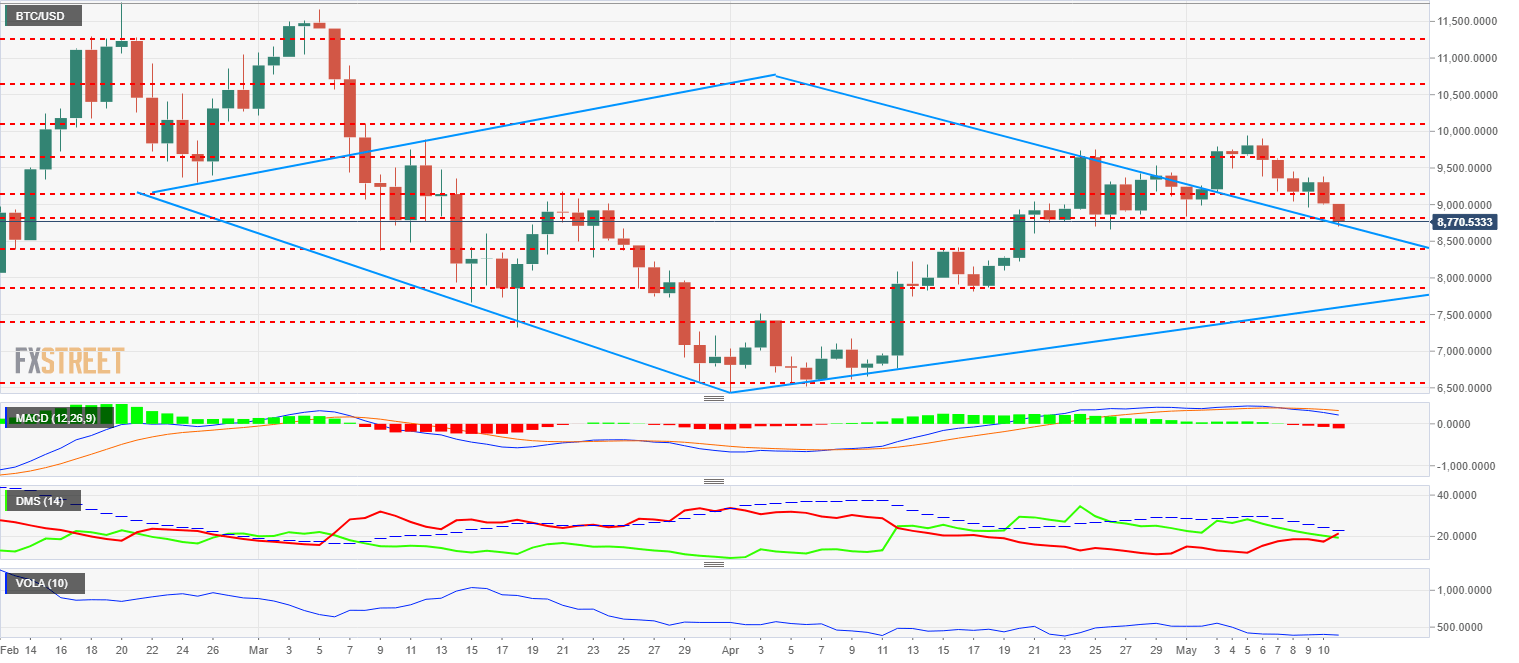
Bitcoin has reached the key support level that rules the Diamond formation trendline that was broken last week. BTC/USD has stopped at $8696 and has recovered the support level located at $8830. If the bearish leg stops at the current levels, it would be positive in the mid-term, as it would match the breaking, confirmation and continuation patterns.
Below the current price, the current support is at $8830, followed by the day's lows in the aforementioned $8696 level. If that one is lost, free room to go down to $8400 and $7860.
On the upside, first resistance is at $9150, followed by $9649 and $10100 as the third resistance.
MACD in the Bitcoin daily chart is crossed to the downside, but same as the Ripple one, still trades on the bullish side. This indicator still has lots of room to cover until the equilibrium point and it is very likely that a bullish short-term move might come up.
Directional Movement Index in the same chart gives a slight edge to the sellers, although not by much. ADX is still falling and doesn't react to the last bearish movements. Buyers have been losing some strength in the last sessions but still far from the levels from last March.
ETH/USD daily chart
-636616337046334493.png)
Ethereum is also experiencing some bearish runs, nearing critical levels to its mid-term outlook too. In this particular scenario, Ethereum is trading below the trendline that has been acting as support since mid-April. ETH/USD has reached the $685 mark to then bounce trying to recover the $700 mark, right where it is fighting at the time of this writing. Above here, recovering $755 and the meaningful $813 would give ETH an ideal situation to attack superior levels.
Below the current price level, if $696 is lost, next supports are at $648 and $621.
MACD in the Ethereum daily chart shows a similar profile to the Bitcoin one, still with a big distance separating it from the 0 line, indicating a clearly bullish bias. Upwards rebounds are very likely, as the bullish attempts in the short term should enjoy a structural support.
Directional Movement Index in the same chart is even more clear than the ones analyzed above. Here, sellers are still slightly below buyers. ADX is losing some strength since relative highs, but still lacking meaningful trend strength.
Author

Tomas Salles
FXStreet
Tomàs Sallés was born in Barcelona in 1972, he is a certified technical analyst after having completing specialized courses in Spain and Switzerland. He expanded his technical training following the guidance of great experts on the financial markets.


