Top 3 Price Prediction Bitcoin, Ripple, Ethereum: Updating the bullish signal level, now at $8,250 BTC/USD
- The ceiling of the bear channel stops an army of Bitcoiners ready to go to the Moon.
- ETH/USD may extend its gains despite Bitcoin weakness.
- XRP/USD is facing increased volatility.

It is mid-morning in Europe, and the market continues with the tonic seen during the weekend of retreat and hammering of the roof of the long term bearish channel. For now, the wall resists, and the market reacts with increased lurching.
The overall structure is not conducive to an upward break in the short term, and if the market achieves this, is likely to consume a considerable amount of capital, and significant consolidation will be necessary.
In the meantime, the ETH/BTC cross continues to project the upward parallel line structure, and after the recent rises, a new lower parallel is drawn.
Long-term moving averages rotate upwards and enter the sequence of crosses that are likely to bring additional volatility until everything aligns upwards.
ETH/BTC Daily Chart
ETH/BTC is currently trading at the price level of 0.0316, just above the support by price congestion at 0.0315. The second support level is at 0.0305 (EMA50 and lower parallel bullish trend line and SMA200), then the third support level is 0.0291 (price congestion support and SMA100).
Above the current price, the first resistance level is at 0.033 (price congestion resistance and second upper parallel trendline), then the second resistance level for the ETH/BTC pair is at 0.035 (price congestion resistance and third upper parallel trendline). The third resistance level is at 0.037 (parallel bullish trend line).
-636939431342735078.png)
The MACD on the daily chart shows a very steep bearish cross profile. It remains in the positive zone of the indicator, and when it approaches the neutral level, we will have to pay attention to whether it stops the decline or dives deeper in negative territory, which would have severe consequences for the market.
The DMI on the daily chart shows a technical tie between the two sides of the market that is both at the level that indicates the presence of the trend or the lack thereof. The ADX sinks and faithfully represents the overall loss of momentum after the gains of the past few weeks.
BTC/USD Daily Chart
BTC/USD is currently trading at $7.877 after the morning attempt to beat the long term bullish channel ceiling by $8.240. The Japanese candlestick figure that is being drawn is complete in its upper zone, so if it closes at around $7.250 or lower, it will form a powerful bearish hedge.
Below the current price, BTC/USD has its first support level at $7,750 (price congestion support), then the second support level is at $7,600 (price congestion support). The third level of support is at $7,400 (price congestion support).
Above the current price, the BTC/USD pair has the first resistance level of $8,000 (price congestion resistance), then the second resistance level is at $8,250 (price congestion resistance). The third resistance level is at $8,400 (price congestion resistance), a level that would give the bullish signal to the real bull market ahead of Bitcoin.
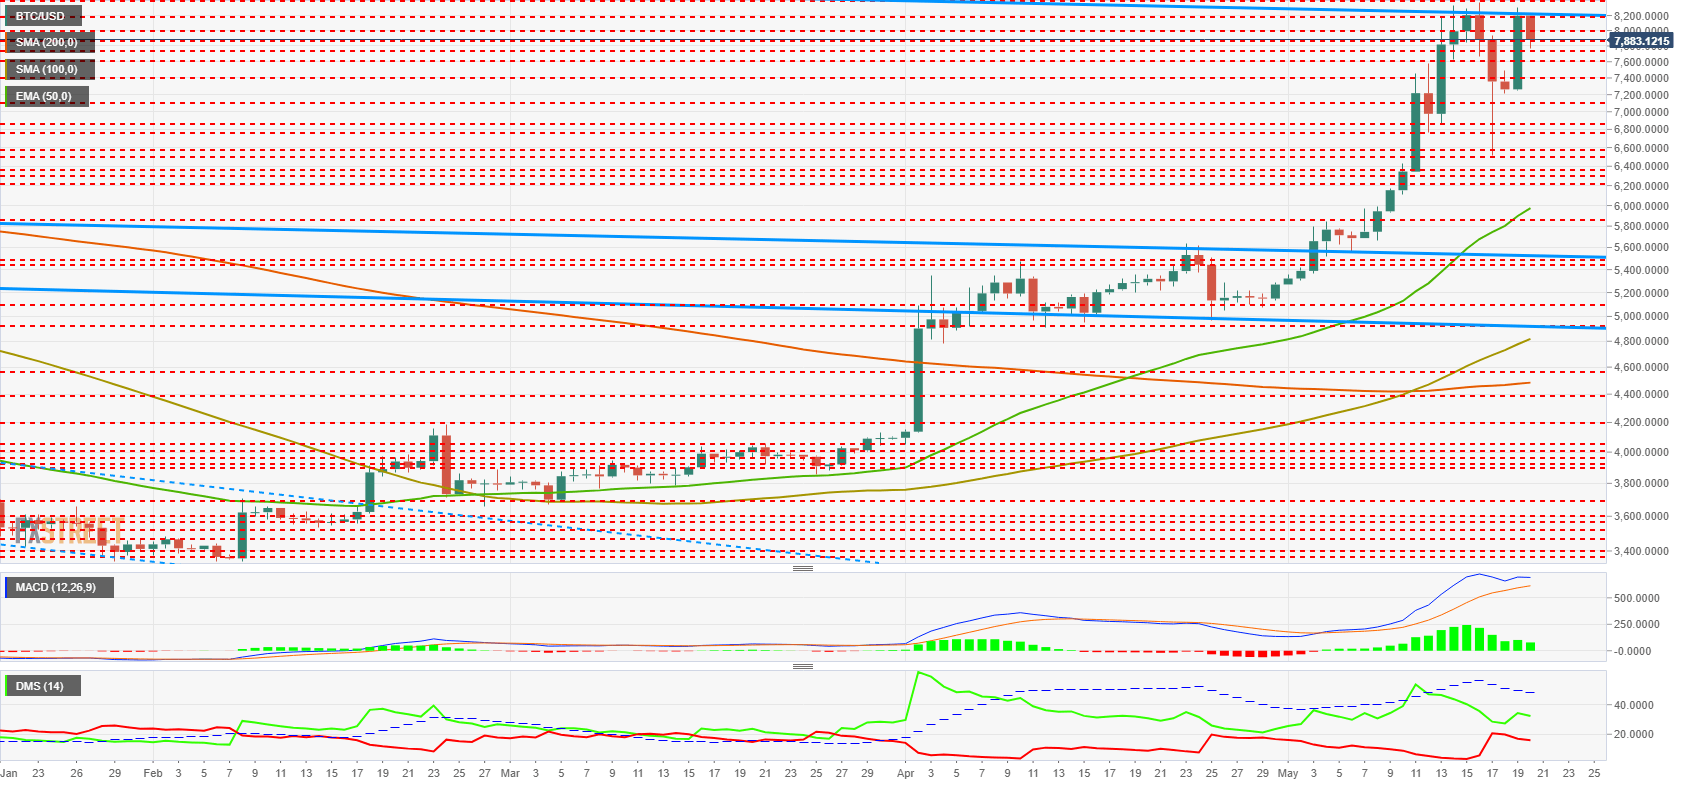
The MACD on the daily chart shows a bullish exhaustion structure and is heading for a more than likely bearish cross. This situation can be lengthened to the extreme.
The DMI on the daily chart shows bulls still ahead of bears. The bearish side's representatives have increased their strength in the last few days, and may soon be in a position to dispute the leadership of the bullish side's representatives.
ETH/USD Daily Chart
ETH/USD is currently trading at the $249 price level, based on the BTC/USD drawing.
Below the current price, the first support level for ETH/USD is $235 (price congestion support), then the second support level for ETH/USD is $224 (price congestion support). The third level of support is at $215 (price congestion support).
Above the current price, the first resistance level is $260 (price congestion resistance), so the second resistance level is $280 (relative maximum). The third resistance level for ETH/USD is at $290 (price congestion resistance).
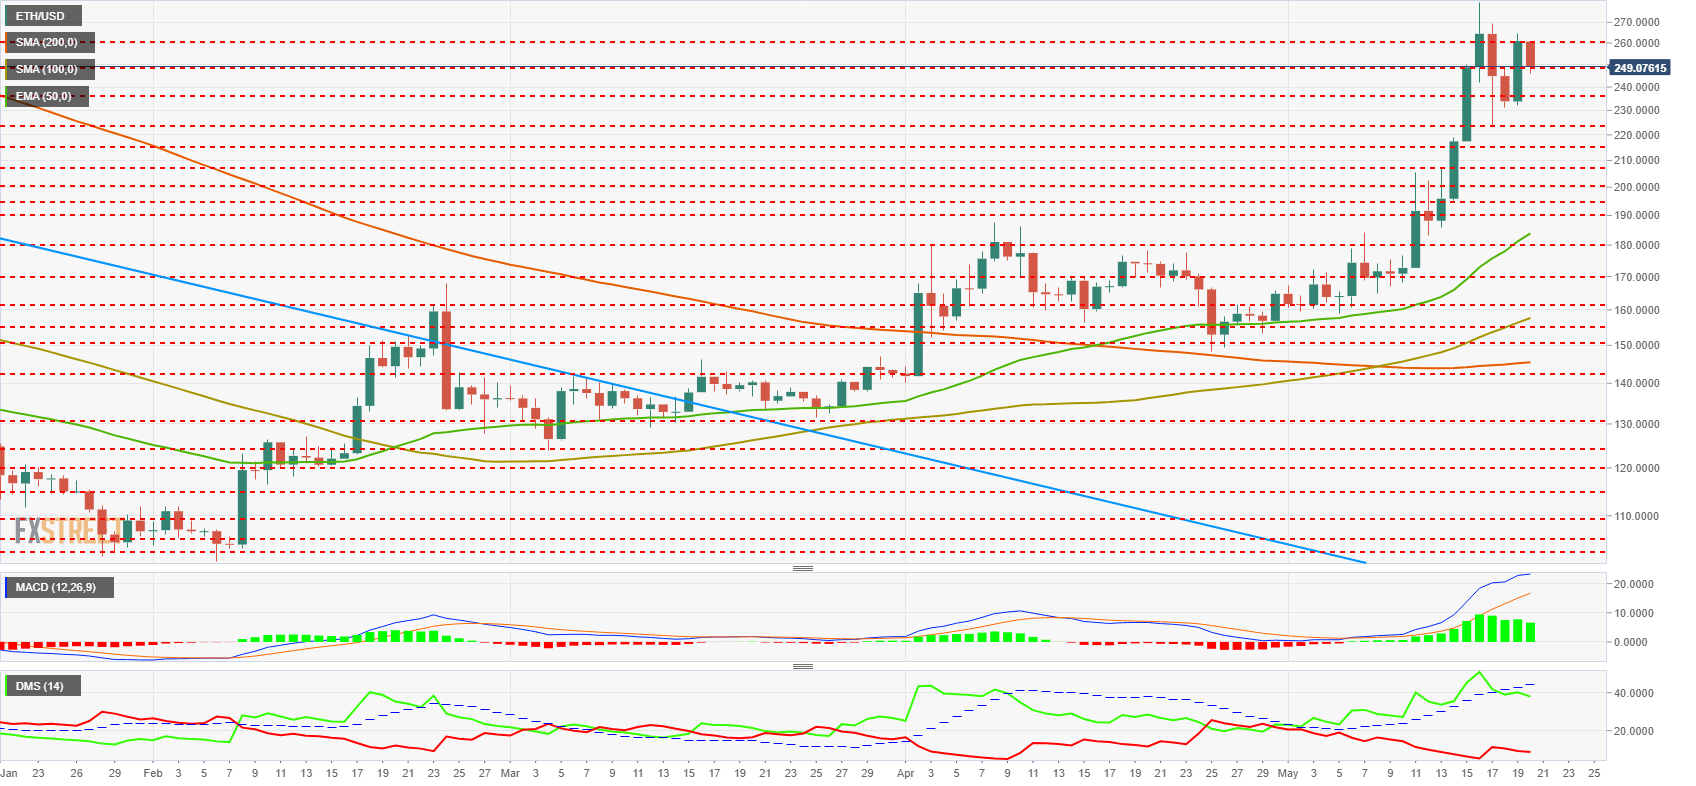
The MACD on the daily chart shows a profile where the bullish force begins to relax but still has a significant uptrend and good opening between the lines.
The DMI on the daily chart shows bulls dominating the market with clarity but that it is placed below the ADX line and initiates a pattern of exhaustion of the buyer side dominance.
XRP/USD Daily Chart
The XRP/USD is trading at $0.395 after a weekend of high intraday volatility that has driven the Ripple star product from $0.47 up to $0.368 down.
Below the current price, the first support level for the XRP/USD pair is $0.39 (price congestion support), then the second support level is $0.37 (price congestion support). The third level of support is at $0.35, a stable zone where the SMA200, the EMA50, and a price congestion support appear.
Above the current price, the first resistance level is $0.412 (price congestion resistance), then the second resistance level is $0.43 (price congestion resistance). The third resistance level is at $0.44 (price congestion resistance).
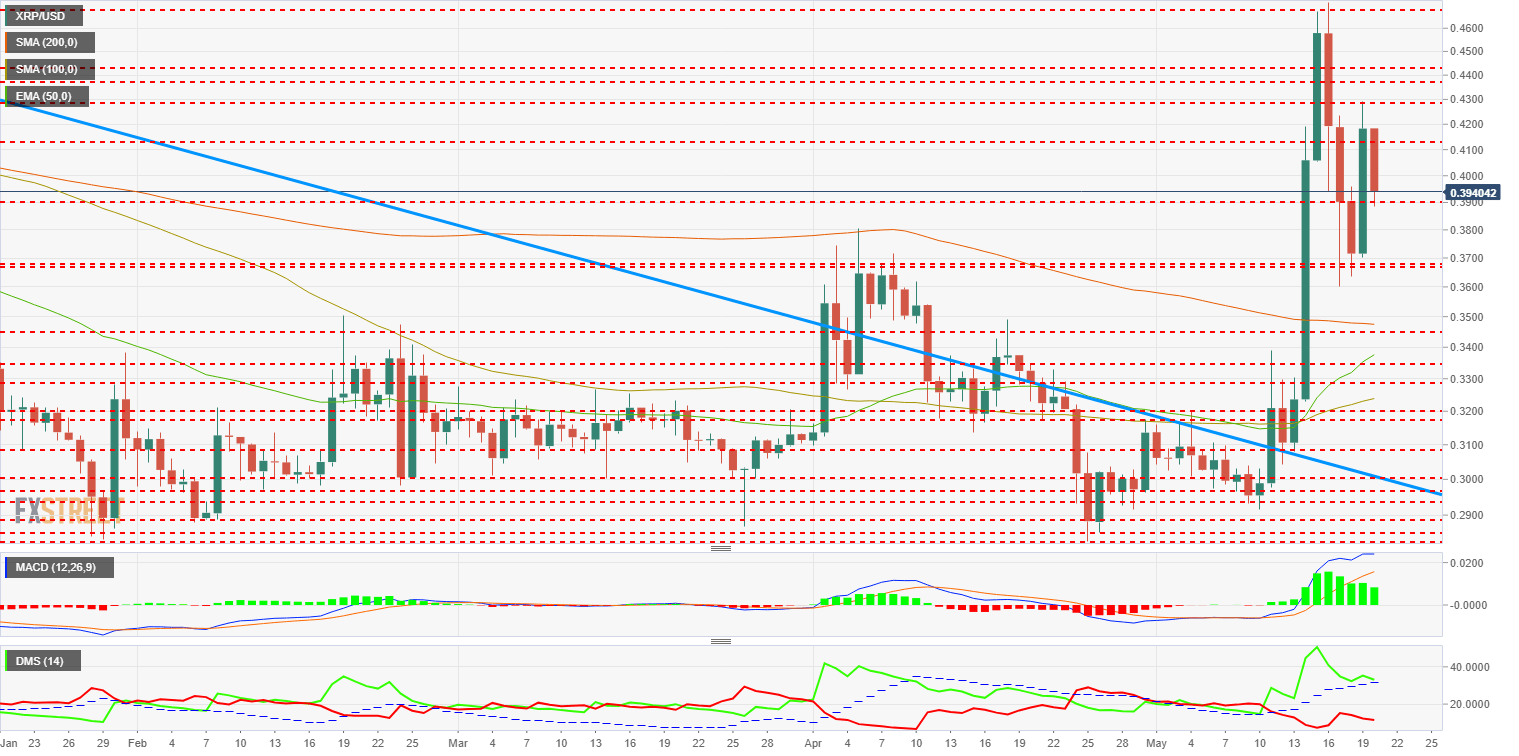
The MACD on the daily chart shows a bullish structure in the depletion phase, although it retains a good opening between the lines and a significant uptrend in the slow average. With this profile, the rises can continue, but in a weak environment.
The DMI on the daily chart shows bulls in control of the market and still above the ADX line but for a short time, as the bulls lose strength and head towards a cross below the trend strength indicator. I want to highlight that the bears do not believe this weakness and withdraw after increasing their trend strength at the end of last week.
Get 24/7 Crypto updates in our social media channels: Give us a follow at @FXSCrypto and our FXStreet Crypto Trading Telegram channel
Author

Tomas Salles
FXStreet
Tomàs Sallés was born in Barcelona in 1972, he is a certified technical analyst after having completing specialized courses in Spain and Switzerland. He expanded his technical training following the guidance of great experts on the financial markets.


