Top 3 Price Prediction Bitcoin, Ripple, Ethereum: Don't look down for shelter
- Distant supports undermine market strength.
- If XRP surprises with rises, the bullish cycle may be reborn.
- A market in a transition phase blinds the short and medium-term outlook.

This trading week begins in a situation identical to that of the previous two ones. The BTC/USD pair is finding it very difficult to conquer the $4,000 price level.
Meanwhile, Ethereum leaves behind the protagonism achieved since December and deactivates the bullish pattern of the ETH/BTC pair. It will need a lot of attention and money to reactivate the pattern in which there is no bullish market if Ethereum does not lead it.
Moving up the timeframes, I find that when examining the weekly chart and applying the Bollinger bands one can see a logic in the current situation. On the one hand, ETH/USD is in the process of confirming the cross to the bullish side of the bands (downward movement). On the other hand, BTC/USD is still in the process of cutting the Bollinger middle line (upward movement).
As long as the situation does not deteriorate further, we can assume to some degree of certainty, or at least in my opinion, that the market is in the final phase of the first bullish section. The next step, to repeat the previous sequence, should give prominence first to the XRP and then the Ethereum.
ETH/BTC 240 Minute Chart
The ETH/BTC pair is currently trading at the price level of 0.034, after confirming the cut in the trend line that governed the most recent bullish movement at 0.0344.
The technical situation of the cross between Ethereum and Bitcoin is delicate. It is very rare for this type of break of support to result in a recovery.
-636891054448993370.png)
Above the current price, the first resistance level is in the accelerated bearish trend line (black dotted) at the 0.0342 price level. The second resistance level for the ETH/BTC pair is at the parallel bullish trend line at the price level of 0.0346. The third resistance level is essential. It is 0.035 (price congestion resistance) and beating it would give the market a strong bullish momentum.
Do you want to know more about my technical setup?
BTC/USD 240 Minute Chart
BTC/USD continues to hold on to the EMA50, moving away from the negative tone that reigns among the leading market players. It is currently trading at the $3,970 price level after trying to breach the $4,000 psychological level over the weekend.
Above the current price, the first resistance level for the BTC/USD pair is precisely at $4,000 (price congestion resistance), while the second resistance level is at $4,050 (price congestion resistance). The third resistance level is at $4,200 (price congestion resistance and relative maximum). If Bitcoin exceeds this price level, it will certify a new upward leg, probably toward the $5,700 price level.
Below the current price, the BTC/USD pair enjoys strong support. The first level of support is a multiple confluence, formed by the EMA50 at $3,967, a price congestion support at $3,957, the SMA100 at the price level of $3,932, another support at $3,995 (price congestion support) and the SMA200 at $3,889.
Below this spectacular support structure, the situation worsens dramatically, as the second level of support for BTC/USD goes below $3,700 (price congestion support), while the third level of support is at the $3,600 price level.
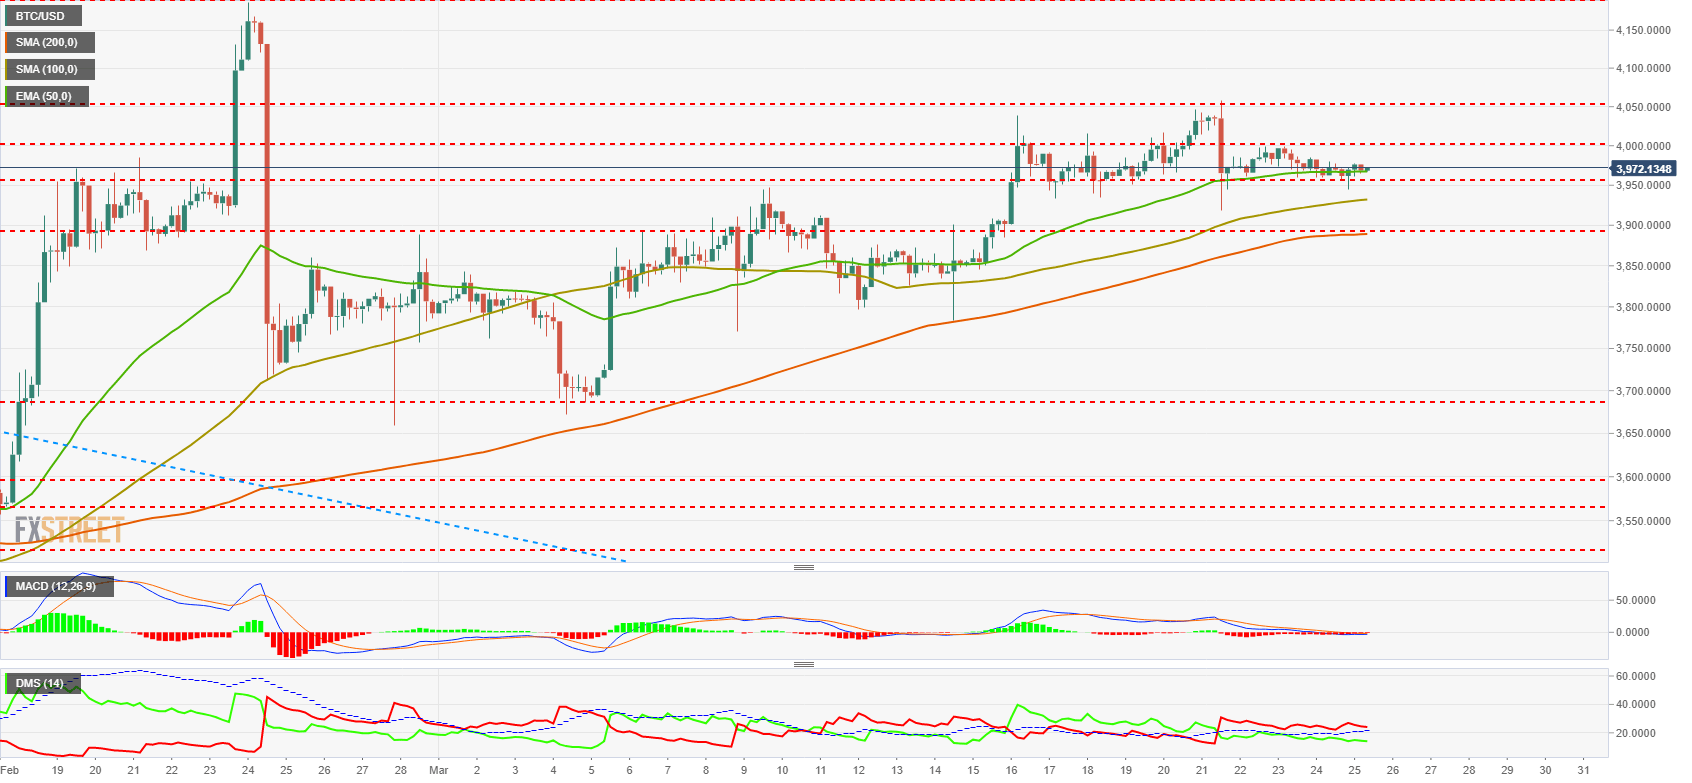
The MACD on the 4-hour chart moves slightly below the neutral line of the indicator. The profile is slightly down and no opening between the lines.
The DMI on the 4-hour chart shows how the bears keep control of the situation without too many problems. The bulls retreat slightly in the past few days and make it easier for the bearish side of the market.
ETH/USD 240 Minute Chart
ETH/USD is currently trading at $136 while remaining close to the strong resistance level formed by the confluence of the three moving averages in the analysis. The structure is negative in the short term.
Above the current price, the first resistance level is formed by the SMA100 at $136.8, then the EMA50 at the price level of $137.3 and finally the SMA200 at $138.2. The second resistance level is at the price level of $142.5 (price congestion resistance), while the third resistance level for the ETH/USD pair is at $151 (price congestion resistance).
Below the current price, the first support level is $130.5 (price congestion support), then the second at $120 (price congestion support). The third level of support for ETH/USD is already far away, at $115 (price congestion support).
-636891056769633973.png)
The MACD on the 4-hour chart is in the negative zone and has a very flat profile. There is NO distance between lines, faithfully representing the lack of directionality of the market.
The DMI in the 4-hour chart shows us that the bears are controlling the market and driving the bulls to lower terrain. The bullish side of the market goes below the ADX and starts a typically bearish pattern.
XRP/USD 240 Minute Chart
XRP/USD is currently trading at $0.307 after losing support at the price congestion area at $0.308. Now it slides down following a bearish trend line that was born on the 20th.
Above the current price, the first resistance level for XRP/USD at $0.3085 where congestion support converges at $0.308 and the bearish trend line at $0.3075. The second resistance level is a confluence in the environment at $0.317, with the EMA50 at $0.312, the SMA100 at $0.314, the SMA200 at $0.316 and the price congestion resistance at $0.317. The third resistance level is at $0.328.
Below the current price, the first support level is at $0.3000 (price congestion support). The second support level is at $0.293 (price congestion support). The third support level for XRP/USD pair is at $0.288 (price congestion support).
-636891057474088287.png)
The MACD on the 4-hour chart is moving in the negative zone of the indicator. The profile is slightly bearish with hardly any line spacing. It is a favorable scheme for bearish continuity.
The DMI on the 4-hour chart shows bulls with absolute control of the market. On the other hand, the bulls retreat with strength and so much force that they have taken the situation to an extreme that can propitiate a bullish rebound by excessive deviation of the price to the common standard.
Get 24/7 Crypto updates in our social media channels: Give us a follow at @FXSCrypto and our FXStreet Crypto Trading Telegram channel
Author

Tomas Salles
FXStreet
Tomàs Sallés was born in Barcelona in 1972, he is a certified technical analyst after having completing specialized courses in Spain and Switzerland. He expanded his technical training following the guidance of great experts on the financial markets.


