Top 3 Price Prediction Bitcoin, Ripple, Ethereum: BTC/USD stands at the gates of the bullish scenario above $8,150
- The bullish scenario is not the most likely one in the short term.
- Cryptos are showing surprising strength despite very negative indicators.
- Ethereum may fall into a multi-weekly bullish mode.

Monday’s US session has witnessed the start of a new attempt by Bitcoin to escape the long-term bearish channel.
BTC/USD failed to reach the channel's ceiling which - at the moment - is slightly below $8,150. It appears that $8,000 is solid enough to refute King Crypto's bullish intention.
The MACD on the weekly ETH/USD chart stands out. The behavior pattern demands that Ethereum does better than Bitcoin for us to see a pure bull market, so this week and probably next week are critical and decisive for the medium and long term.
ETH/BTC Daily Chart
The ETH/BTC daily chart shows a healthy support level at 0.0319, while a strong confluence between the 0.031 and 0.0325 has blocked any bullish attempt.
This confluence awaits above the current price. It starts at 0.031(EMA50), receives another boost at 0.0316 (price congestion resistance) and as a formidable final reinforcement at 0.0321, the SMA100, SMA200, and the upper trend line of the bullish parallel structure that guides the pair. The second resistance level for the ETH/BTC cross is 0.0332 (price congestion resistance). The third resistance level is at 0.0337 (second parallel bullish line of the bullish parallel structure).
Below the current price, the first support level is at 0.030 (price congestion support), then the second support level is at 0.0290 (price congestion support). The third support level for the ETH/BTC pair is at 0.0275 (price congestion support).
-636958478848347390.png)
The MACD on the daily chart shows a flat structure. It is a complicated structure due to the profile, which shows an absolute lack of volatility. Violent price movements can occur in both directions.
The DMI on the daily chart shows how – despite the low volatility – bulls remain above the ADX line, thus giving the bullish side of the market advantage. On the other hand, bears, stand up and gradually increase their level of trend strength.
BTC/USD Daily Chart
BTC/USD is currently trading at the $7,820 price level and shows some difficulty conquering the might $8,000 level. The closeness of the critical level at $8,150 may have a lot to do with this behavior.
Above the current price, the first resistance level is at $8,000 (price congestion resistance), then the second resistance level is at $8,150 (long term down channel trend line ceiling). The third resistance level for the BTC/USD pair is at $8,812 (price congestion resistance and relative maximum).
Below the current price, the first support level is at $7,880 (price congestion support), then the second support level is at $7,720 (price congestion support). The third level of support for BTC/USD is at $7,500 (price congestion support).
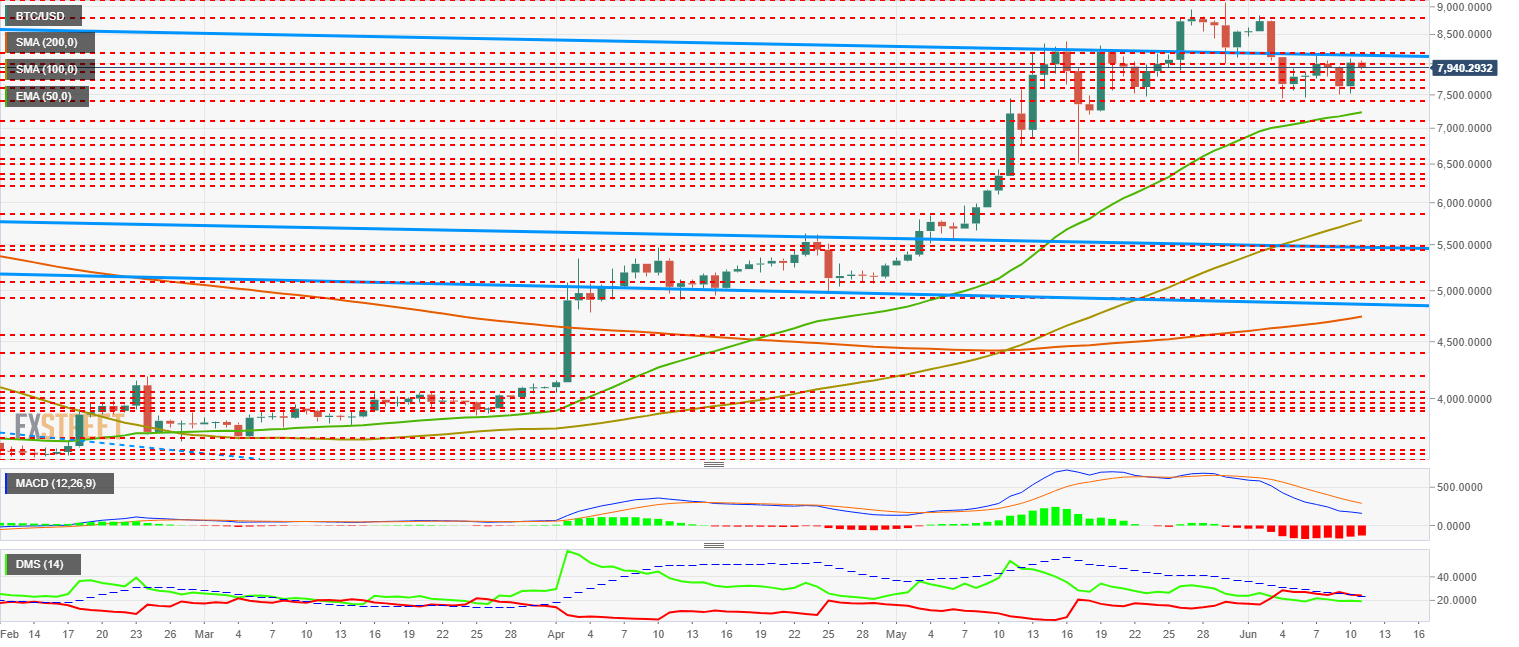
The MACD on the daily chart shows how the rally seen on Monday has hardly impacted the profile of the averages. The pattern continues to be very bearish but within a structure more typical of consolidation than of a bearish trend.
The DMI on the daily chart shows how the two sides of the market are very close to each other. Bears have a slight advantage over bulls but are not clearly above the ADX line.
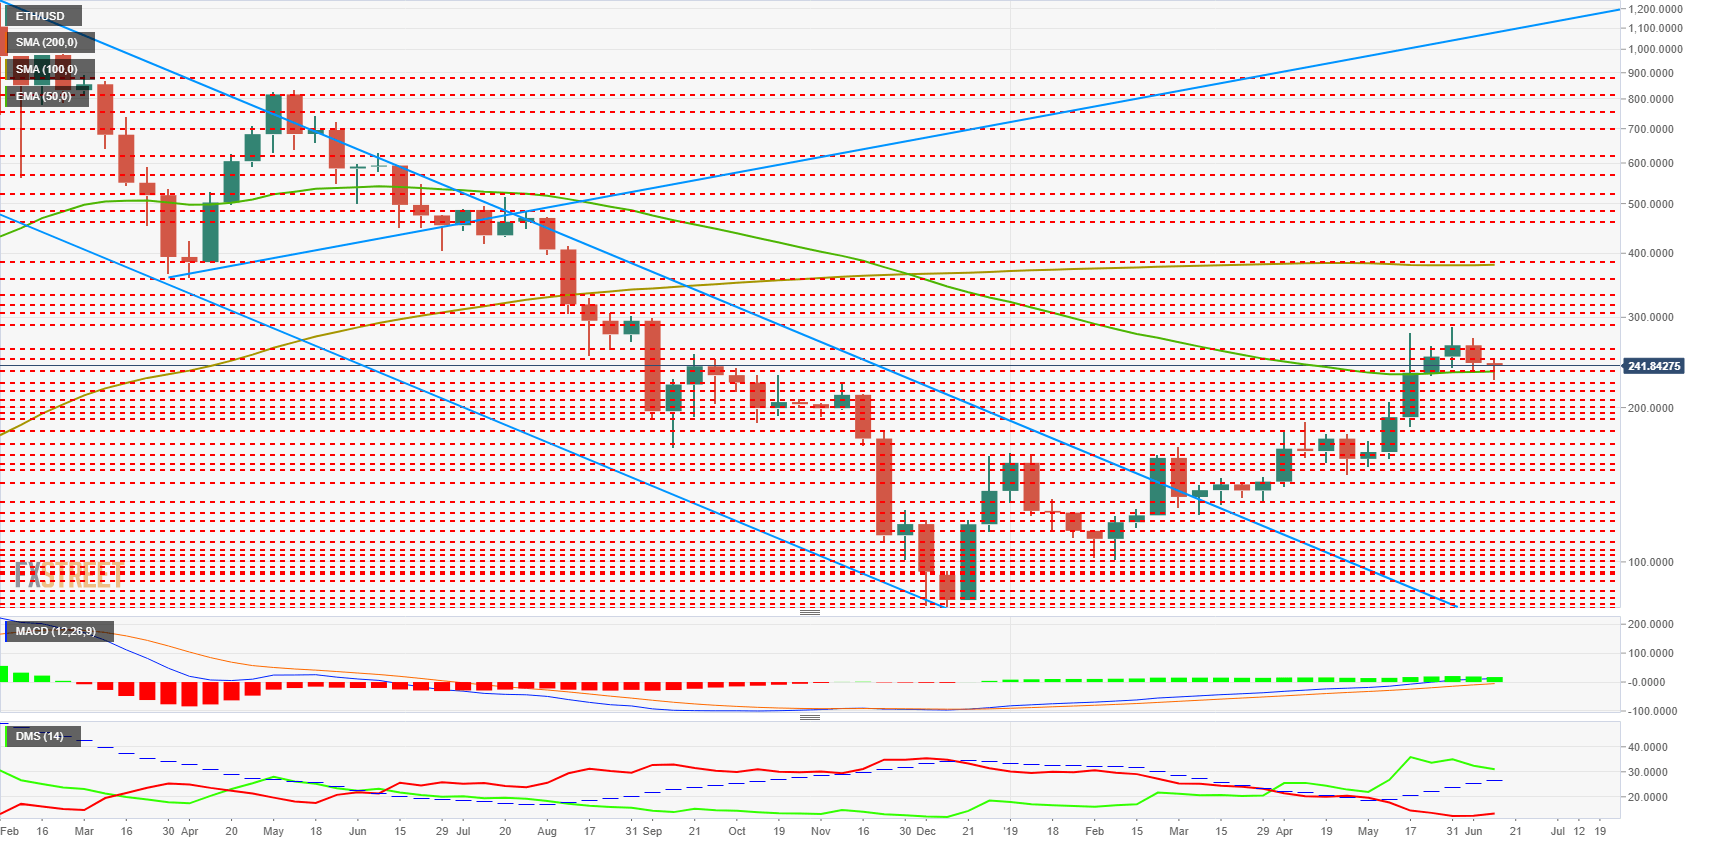
ETH/USD Daily Chart
ETH/USD is currently trading at $242.3. Above the current price, the first resistance level is at $250 (price congestion resistance). The second resistance level is at $260 (price congestion resistance), then the third resistance level is at $290 (price congestion resistance and relative maximum).
Below the current price, the first support level is at $235 (price congestion support), then the second support level is at $223 (price congestion support and EMA50). The third level of support for the ETH/USD pair is at $215 (price congestion support).
The MACD on the daily chart barely represents yesterday's gains and continues to show a bearish development profile for the next few days.
The DMI on the daily chart shows bears controlling the situation. The bulls remain flat below the 20 levels.
XRP/USD Daily Chart
The XRP/USD is currently trading at the $0.393 price level and remains in the range conquered in the middle of last month.
Above the current price, the first resistance level is $0.415 (price congestion resistance), then the second resistance level is $0.43 (price congestion resistance). The third resistance level for the XRP/USD pair is $0.44 (double price congestion resistance).
Below the current price, the first support level is $0.39 (price congestion support), then the second support level is $0.38 (EMA50). The third support level for the XRP/USD pair is $0.368 (double price congestion support).
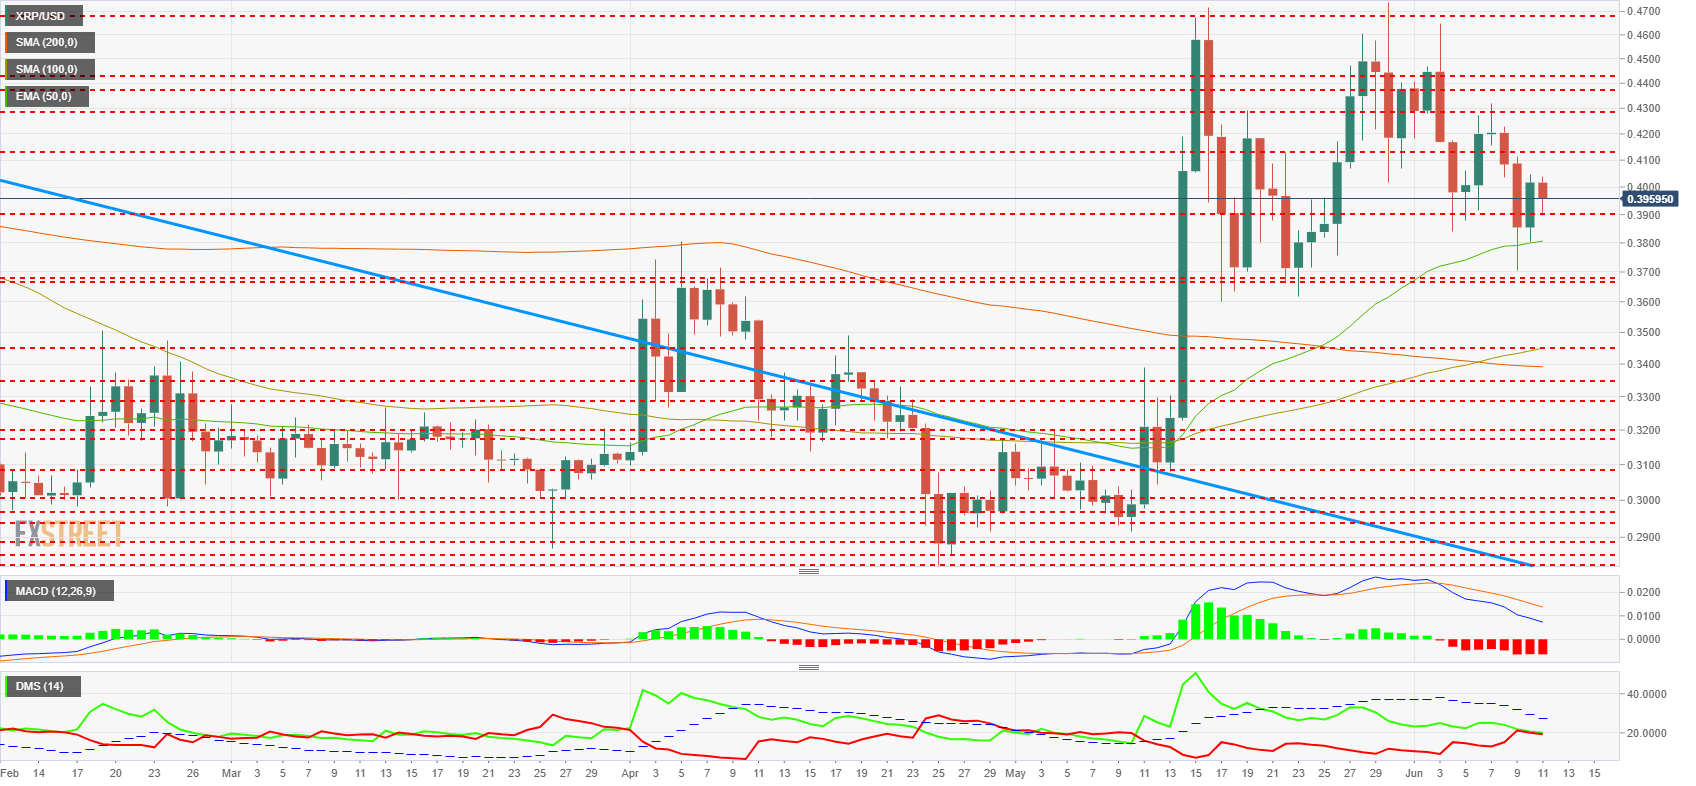
The MACD on the daily chart maintains the bearish slope as well as the opening between the lines. It retains the bearish potential and contrasts the strength that the price shows.
Get 24/7 Crypto updates in our social media channels: Give us a follow at @FXSCrypto and our FXStreet Crypto Trading Telegram channel
Author

Tomas Salles
FXStreet
Tomàs Sallés was born in Barcelona in 1972, he is a certified technical analyst after having completing specialized courses in Spain and Switzerland. He expanded his technical training following the guidance of great experts on the financial markets.


