Top 3 Price Prediction Bitcoin, Ripple, Ethereum: BTC/USD faces a road to $5,870, 50% Fibonacci retracement from lows
- BTC/USD leads the new formation of a bearish trend.
- ETH/USD has 38.2% Fibonacci reversals and its likely target is $205.
- XRP/USD can surprise and find support at $0.30.

The end of the week is approaching, and the Crypto market continues to develop the expected corrective guideline. For now, we are not witnessing severe losses of up to 30% in Bitcoin, a typical behavior in all its upward processes that some have warned of.
The last time BTC/USD found itself in a similar situation, the price went sought the base of the long term bearish channel, as a prelude to the fall and in search of the lows reached in December.
If the process repeats, we would have a few months of bearish sideways ahead, but the difference between the two situations is that back then BTC/USD was accelerating a bearish trend and now the short term trend remains bullish. This difference suggests that the previous fails, but we cannot rule it out.
Should history repeat itself, Bitcoin’s target would be around $5,500, an approximate 30% drop from the cycle highs.
ETH/BTC 4 Hours Chart
The ETH/BTC crypto cross, an instrument that I take as a guide of the underlying forces in the market, has fallen sharply in recent hours, finding a bottom at the lower trend line of the bullish parallel structure that governs the movement.
The bearish movements of ETH/BTC initiated at the beginning of the month projected more parallel bullish lines and extended the scenario, currently providing scope for falls to levels below 0.03.
ETH/BTC is currently trading at 0.0308 and it is about to break down the parallel bullish trend line. In the Asian session, the EMA50 was pierced, and due to the structure of the longer term moving averages, this future scenario indicates the zone between 0.030 and 0.029 as transit zones for a few weeks.
Above the current price, the first resistance level is at 0.0313 (EMA50), then the second resistance level is at 0.0316 (congestion resistance). The third resistance level for ETH/BTC is 0.033 (price congestion resistance). Above this price level, the pair would enter a bullish phase again.
Below the current price, the first support level is 0.0307 (parallel bullish trend line), then the second support level is 0.03 (congestion support, SMA100, and SMA200). The third support level for ETH/BTC awaits at 0.029 (parallel bullish trend line and price congestion support).
-636942075895516338.png)
The MACD on the four-hour chart shows a very particular and ambiguous profile. The averages are crossed down just above the 0 lines and with a precise angle. It can evolve towards both sides of the market without any surprise.
The DMI on the four-hour chart shows the bears taking the lead in the market while the bulls lose ADX support and go to two-week lows. The status of this indicator supports a downward resolution of the MACD scenario.
BTC/USD Daily Chart
BTC/USD is currently trading at the $7,540 price level on the fourth consecutive day of declines. At first glance, the price weakness will continue over time. In no case can we speak of a change of trend in the medium term, which remains in bullish mode.
Above the current price, the first resistance level is $7,600 (price congestion resistance), then the second resistance level is at $7,750 (price congestion resistance). The third resistance level for BTC/USD is $7,860 (price congestion resistance).
Below the current price, the first support level is $7,400 (price congestion support), then the second support level is $7,100 (price congestion support). The third level of support for the BTC/USD pair is at $6,900 (price congestion support).
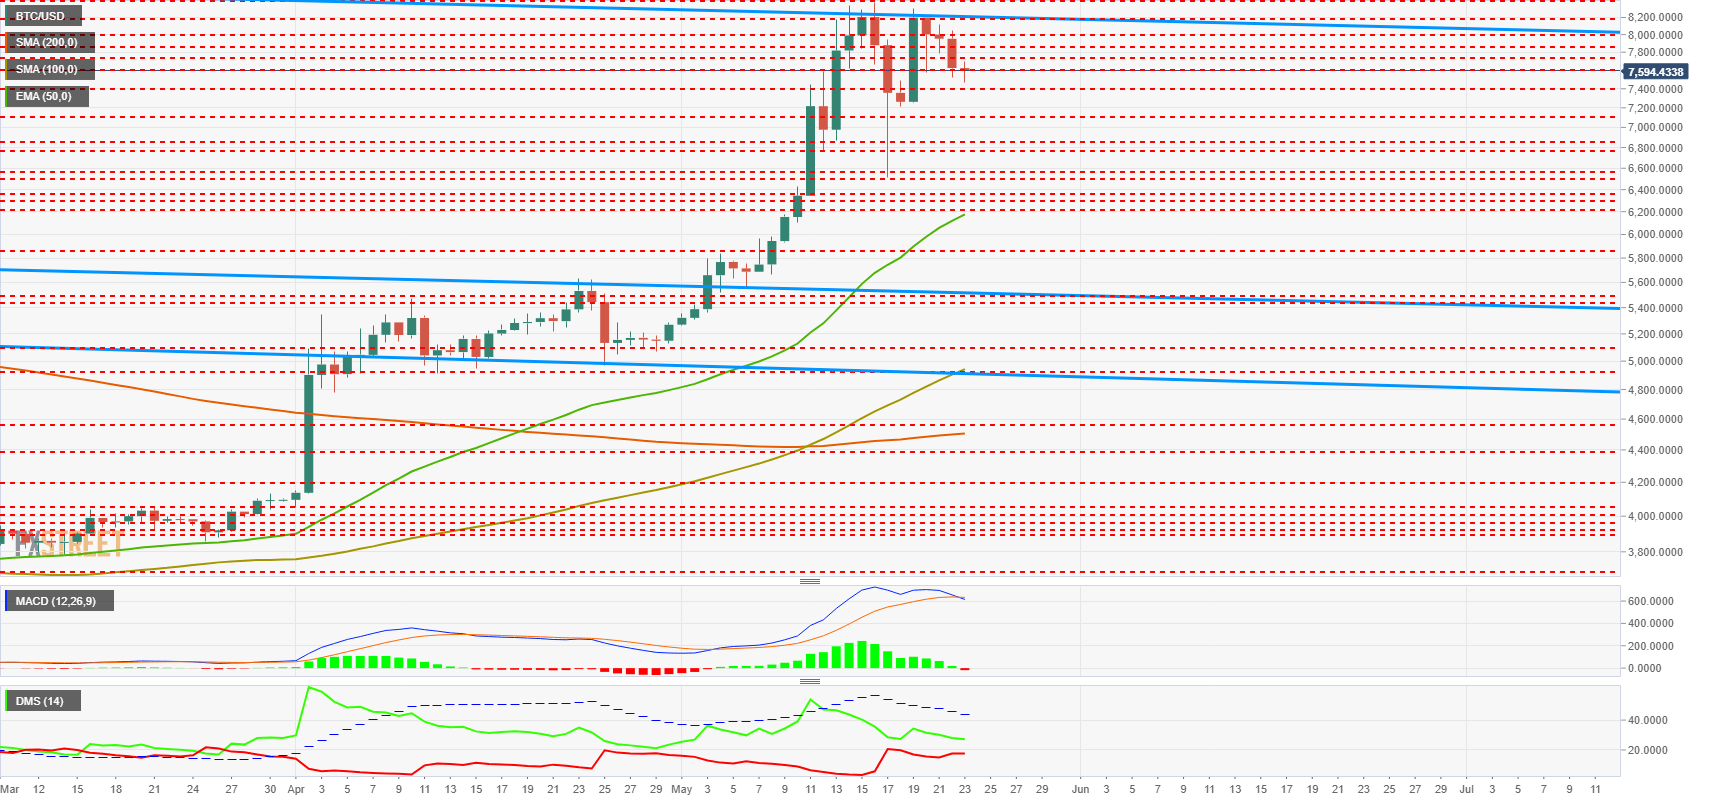
The MACD on the daily chart shows an incipient bearish cross, which for now has the minimal inclination and no opening between lines. The main scenario is lateral bearish.
The DMI on the daily chart shows the bulls still controlling the market, although the bears have been with high spirits for days in looking for their moment.
ETH/USD Daily Chart
ETH/USD is currently trading at the $236 price level and maintains the range of the previous days.
Above the current price, the first resistance level is at $250 (price congestion resistance), then the second resistance level is at $260 (price congestion resistance). The third resistance level for the ETH/USD pair is at $280 (price congestion resistance).
Below the current price, the first support level is at $225 (price congestion support), then the second support level is at $215 (price congestion support). The third level of support for the ETH/USD pair is at $208 (price congestion support).
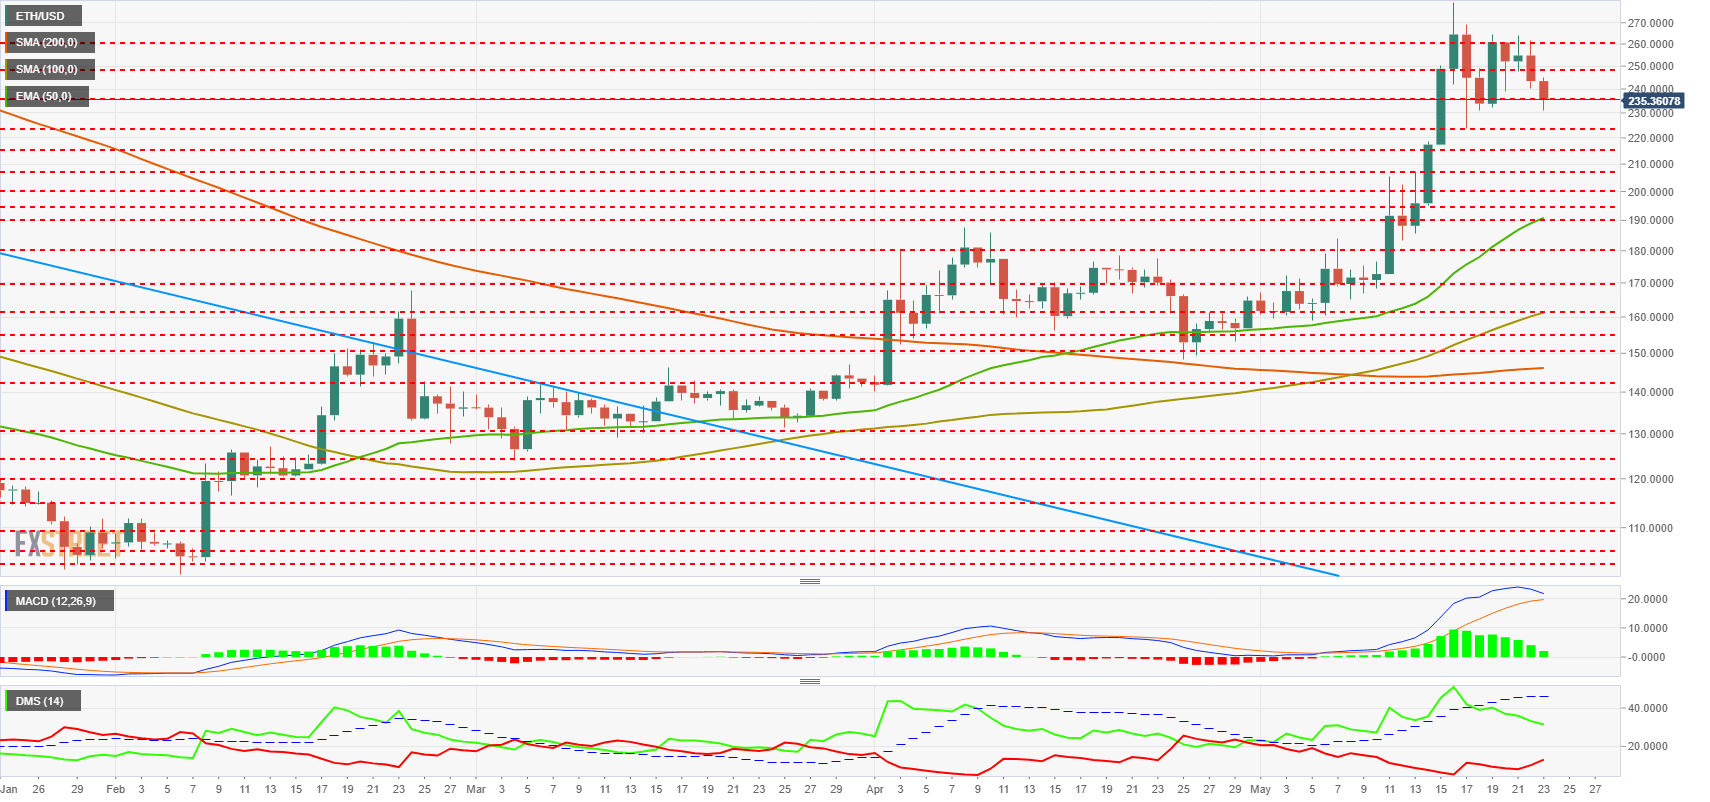
The MACD on the daily chart shows a less evolved profile than the BTC/USD. In the case of Ethereum, there are still one or two days before the bearish cut occurs. For now, it is set to behave better than Bitcoin.
The DMI in the daily chart shows the bulls dominating the situation despite losing some of the strength they had before. The bears react with intensity in the past few hours.
XRP/USD Daily Chart
The XRP/USD is currently trading at the $0.366 price level, resting just above the active support zone at $0.367.
The XRP has also not left its consolidation zone and is also at a less advanced stage than Bitcoin.
Above the current price, the first resistance level is $0.039 (price congestion resistance), then the second resistance level is $0.41 (price congestion resistance). The third resistance level for the XRP/USD pair is $0.43 (price congestion resistance).
Below the current price, the first support level is $0.367 (price congestion support), then the second support level is $0.344 (price congestion support, SMA200, and EMA50). The third level of support for XRP/USD is $0.33 (price congestion support and SMA100).
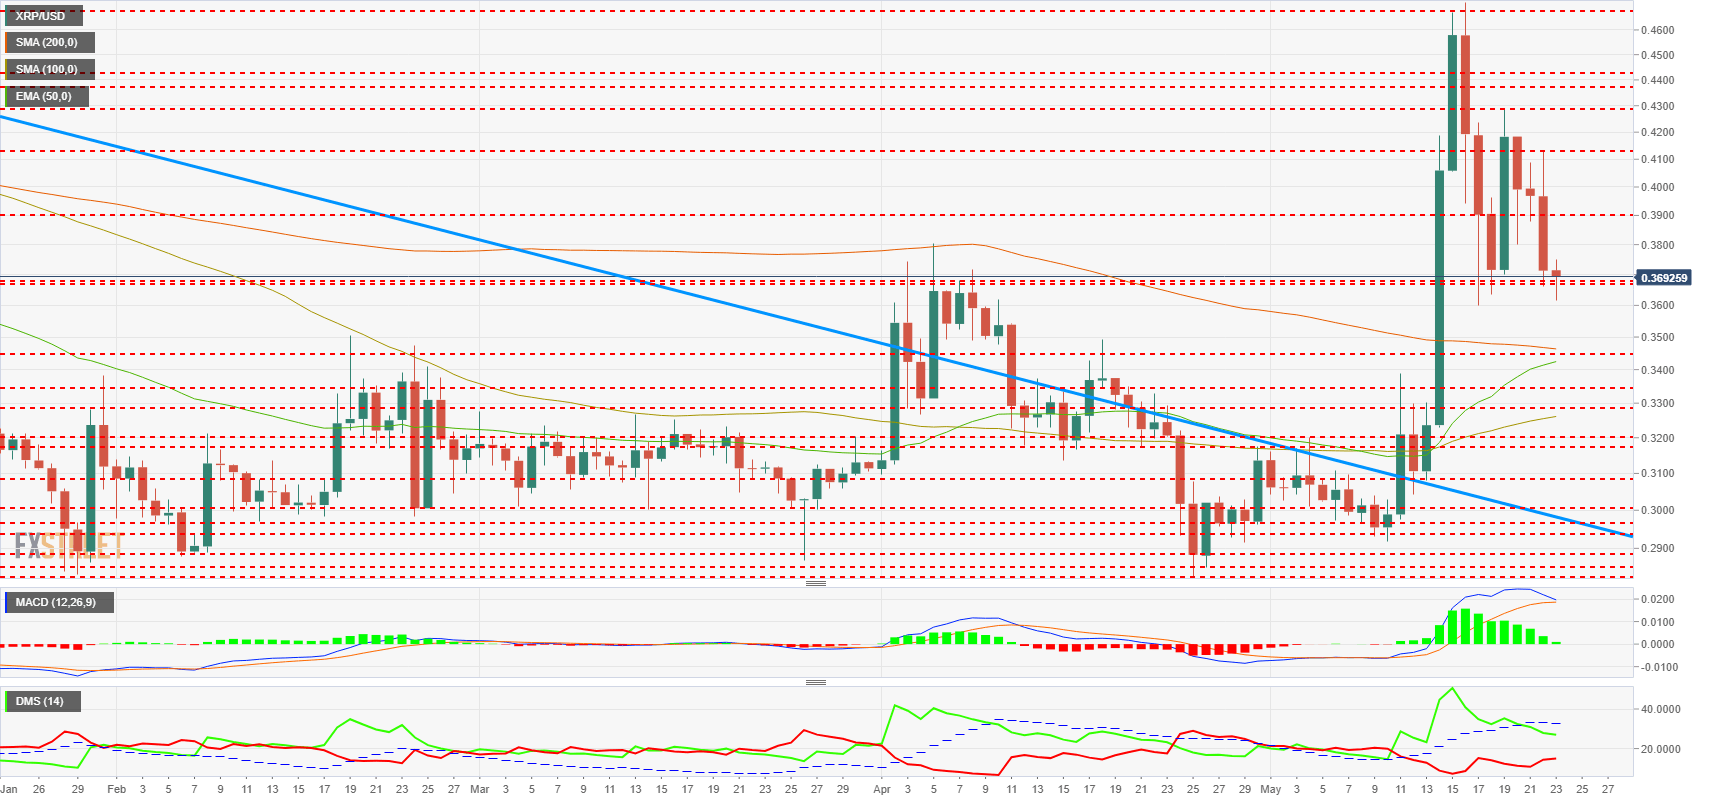
The MACD on the daily chart shows a negative inclination though there is no ongoing bearish trend yet. It is a risky configuration and can lead to sharp declines and recoveries in a high volatility environment.
The DMI on the daily chart shows how the bulls keep control of the situation, although already below the ADX line. The bears continue to increase their activity and are approaching the 20 levels of the indicator.
Author

Tomas Salles
FXStreet
Tomàs Sallés was born in Barcelona in 1972, he is a certified technical analyst after having completing specialized courses in Spain and Switzerland. He expanded his technical training following the guidance of great experts on the financial markets.


