Top 3 Price Prediction Bitcoin, Ethereum, Ripple: XRP keeps the lead ahead of BTC and ETH
- Bitcoin price tries to rebound from a critical support level on the daily chart.
- Ethereum follows BTC closely but has more strength in the short-term and remains trading around $2,000.
- Ripple price outperformed every other big crypto after a massive 100% rally to new three-year high at $1.19.

The cryptocurrency market has recovered slightly from a $150 billion dip, gaining back around $80 billion, but the top three cryptocurrencies are not out of danger just yet. XRP took the lead in the past week and maintains a significant advantage over the rest. Ripple gained $22 billion in market capitalization in less than two days.
Bitcoin price defends critical support level
On the daily chart, Bitcoin has managed to hold above the 50 EMA support level which has been a strong support point since the beginning of October 2020. However, this moving average is currently located at $53,300, which means BTC can still see further downside action.
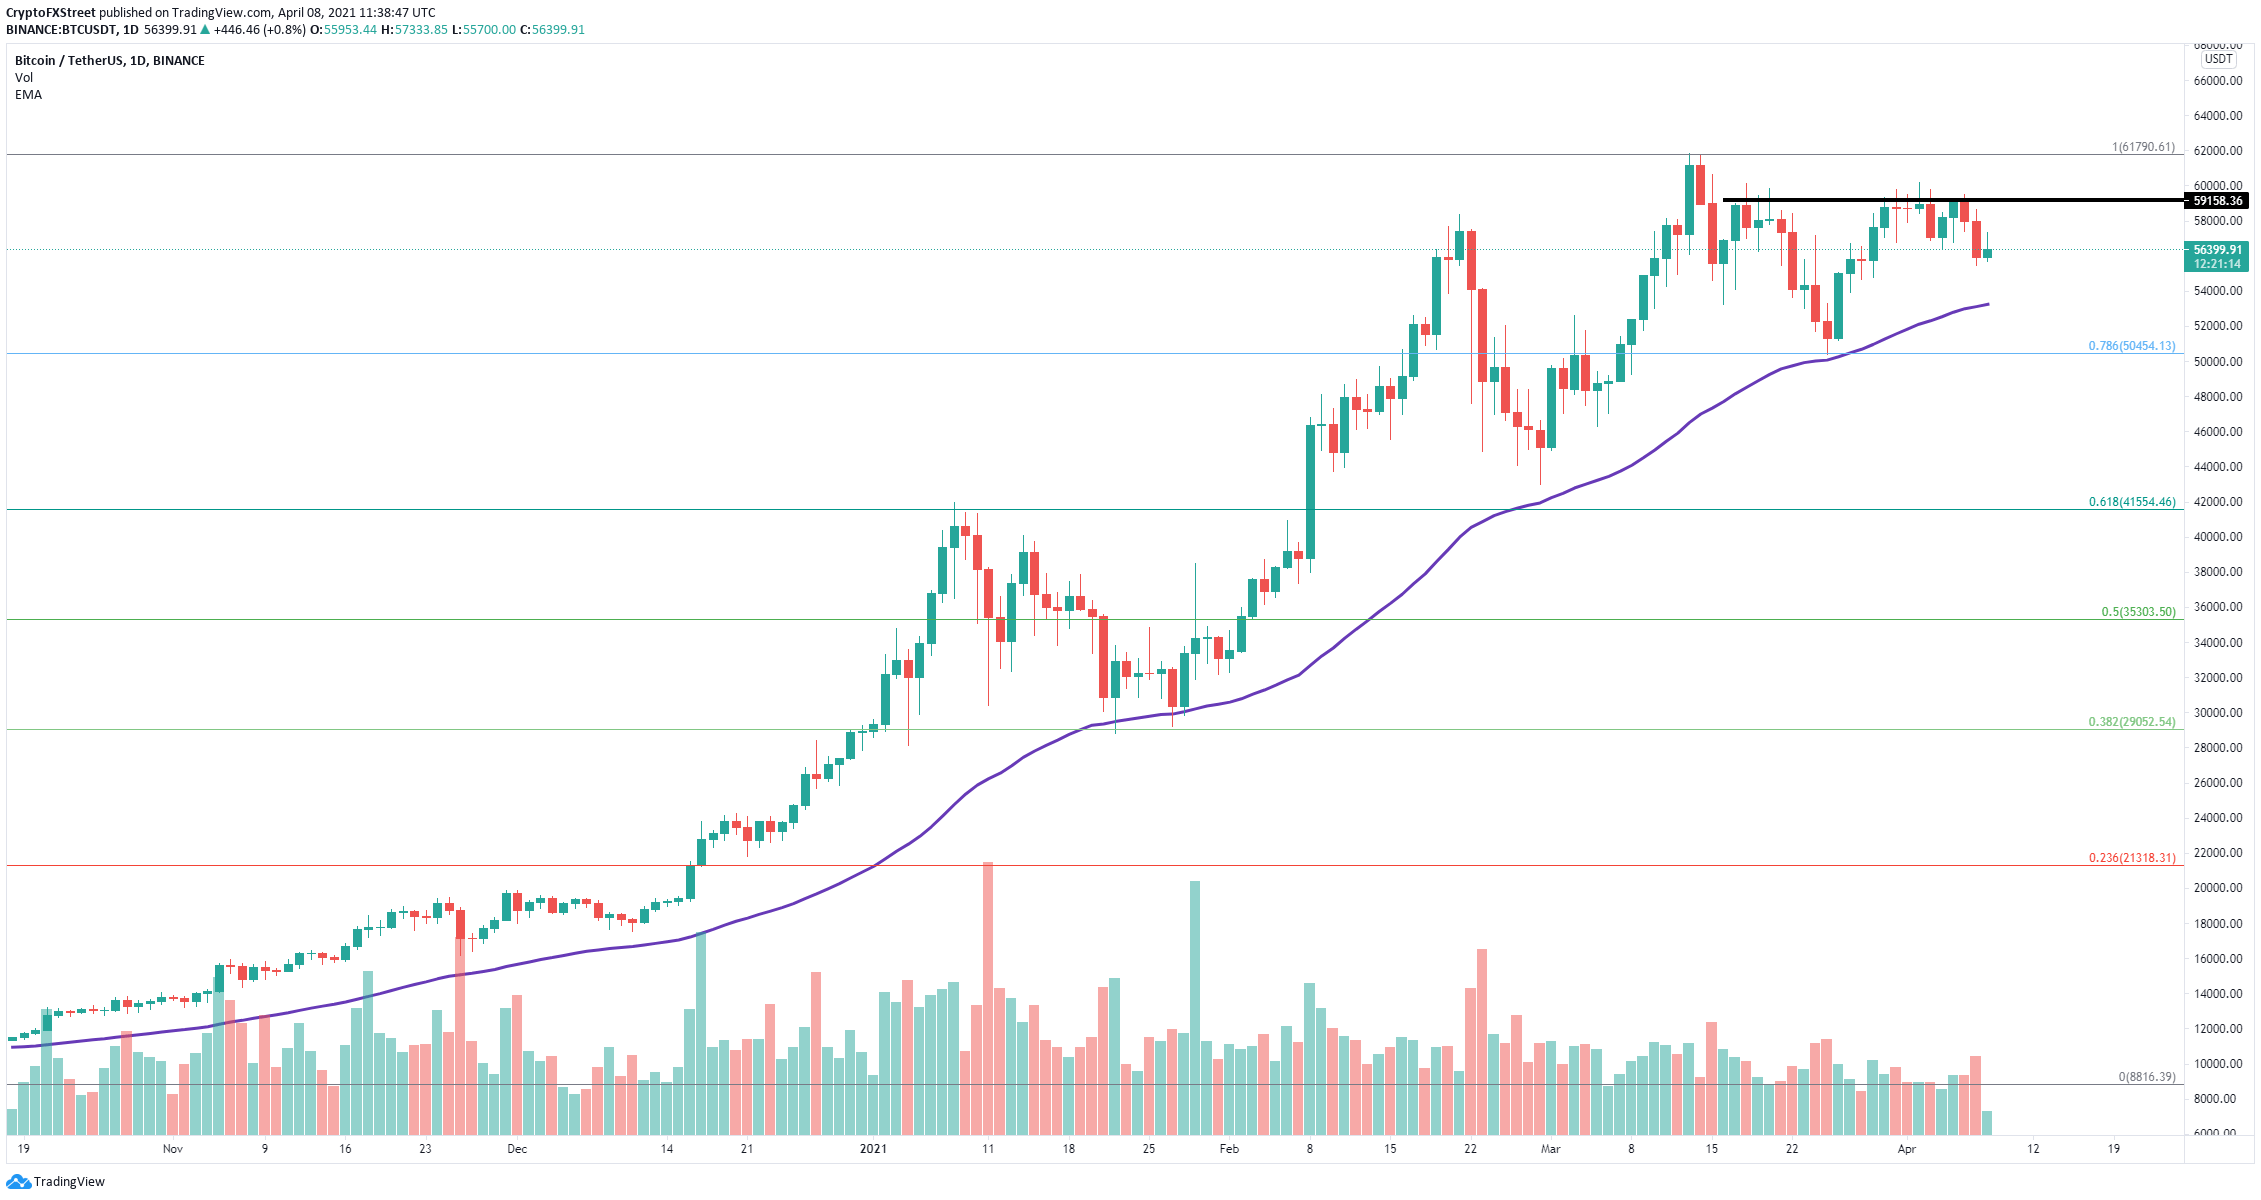
BTC/USD daily chart
The most significant resistance level on the way up is located at $59,000. A breakout above this key point should drive the Bitcoin price toward the previous all-time high of $61,844. However, it seems that BTC whales have been selling for the past month.
%20[13.39.35,%2008%20Apr,%202021]-637534813170623593.png)
BTC Holders Distribution chart
The number of whales with 10,000 to 100,000 BTC decreased by 10 in the past month. Similarly, the number of large holders with 1,000 to 10,000 BTC also dropped significantly from 2,274 to 2,158 since March.
Losing the 50 EMA support level will quickly drive the Bitcoin price down to $50,450 at the 78.6% Fibonacci retracement level, which coincides with the low of March 25.
Ethereum’s uptrend is at no risk according to technicals
On the daily chart, Ethereum established a robust support trend line since the beginning of January. This boundary is currently located at $1,700, which means that anything above this level poses no threat to the bulls.
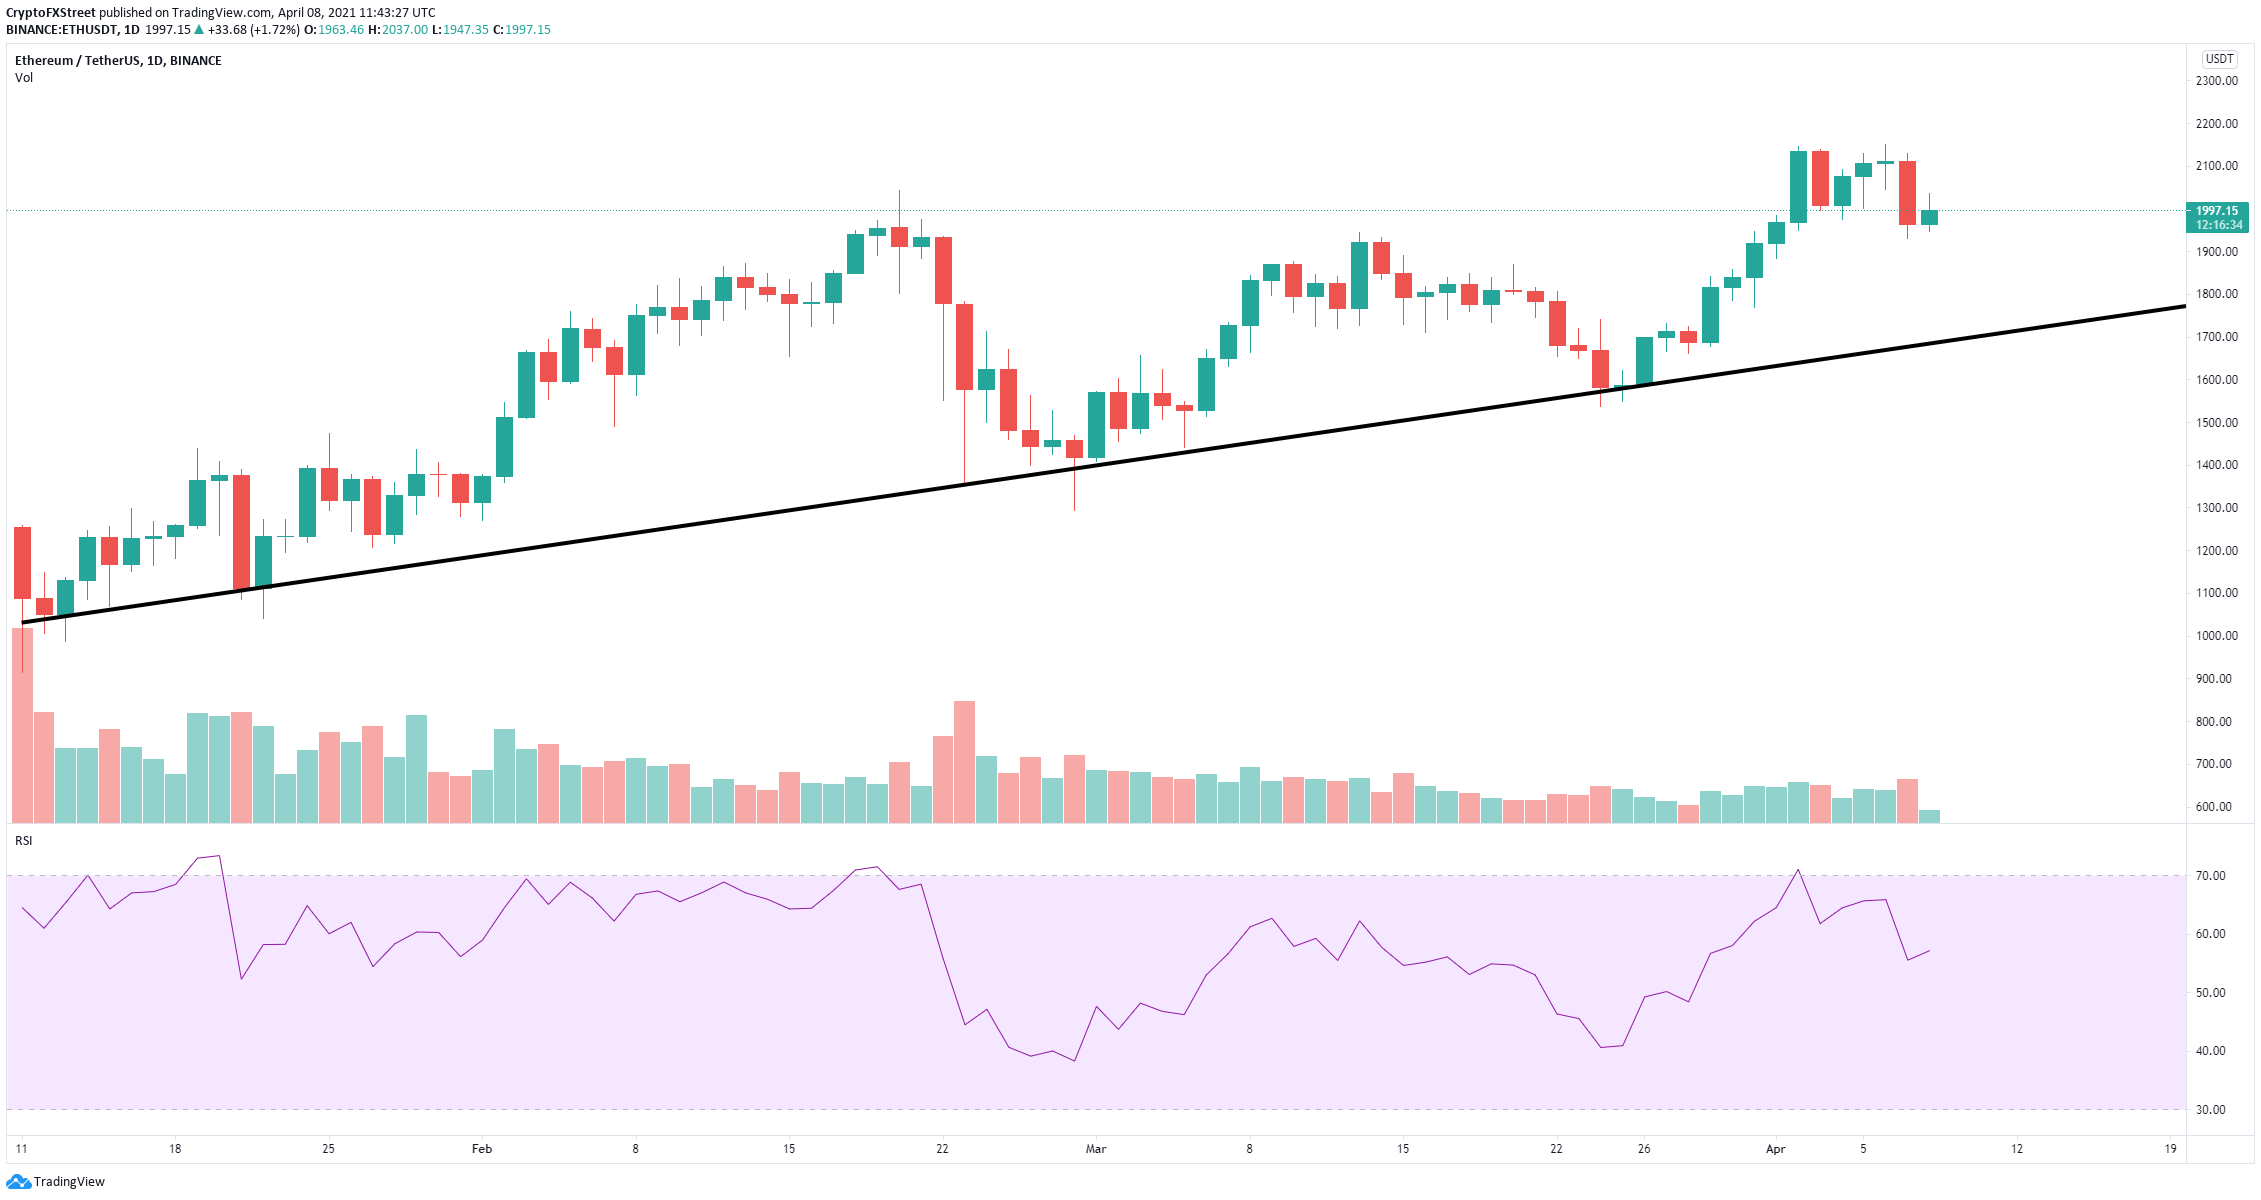
ETH/USD daily chart
Additionally, the RSI, which was overextended, has cooled off notably to about 56 points, which means ETH has a lot of room for a new leg up above the all-time high of $2,151.
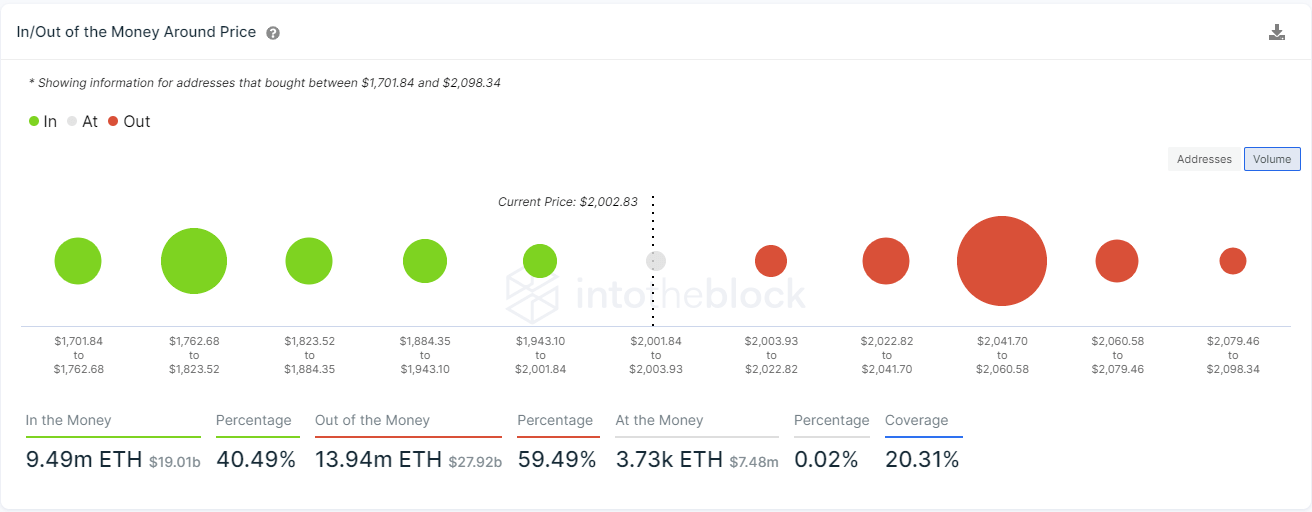
ETH IOMAP chart
The most significant resistance area is located between $2,041 and $2,060 where 152,000 addresses purchased over 10.8 million ETH. This is shown by the In/Out of the Money Around Price (IOMAP) chart. A breakout above this point should push Ethereum into new all-time highs.
However, at the same time, there is weak support below the current price until the robust trend line at $1,700.
Ripple price faces massive selling pressure after 100% rally
On the daily chart, the TD Sequential indicator has just presented a sell signal and a green ‘8’ candlestick on the 3-day chart, which is often followed by a sell signal as well. This comes as no surprise due to the recent massive 100% rally that XRP experienced.
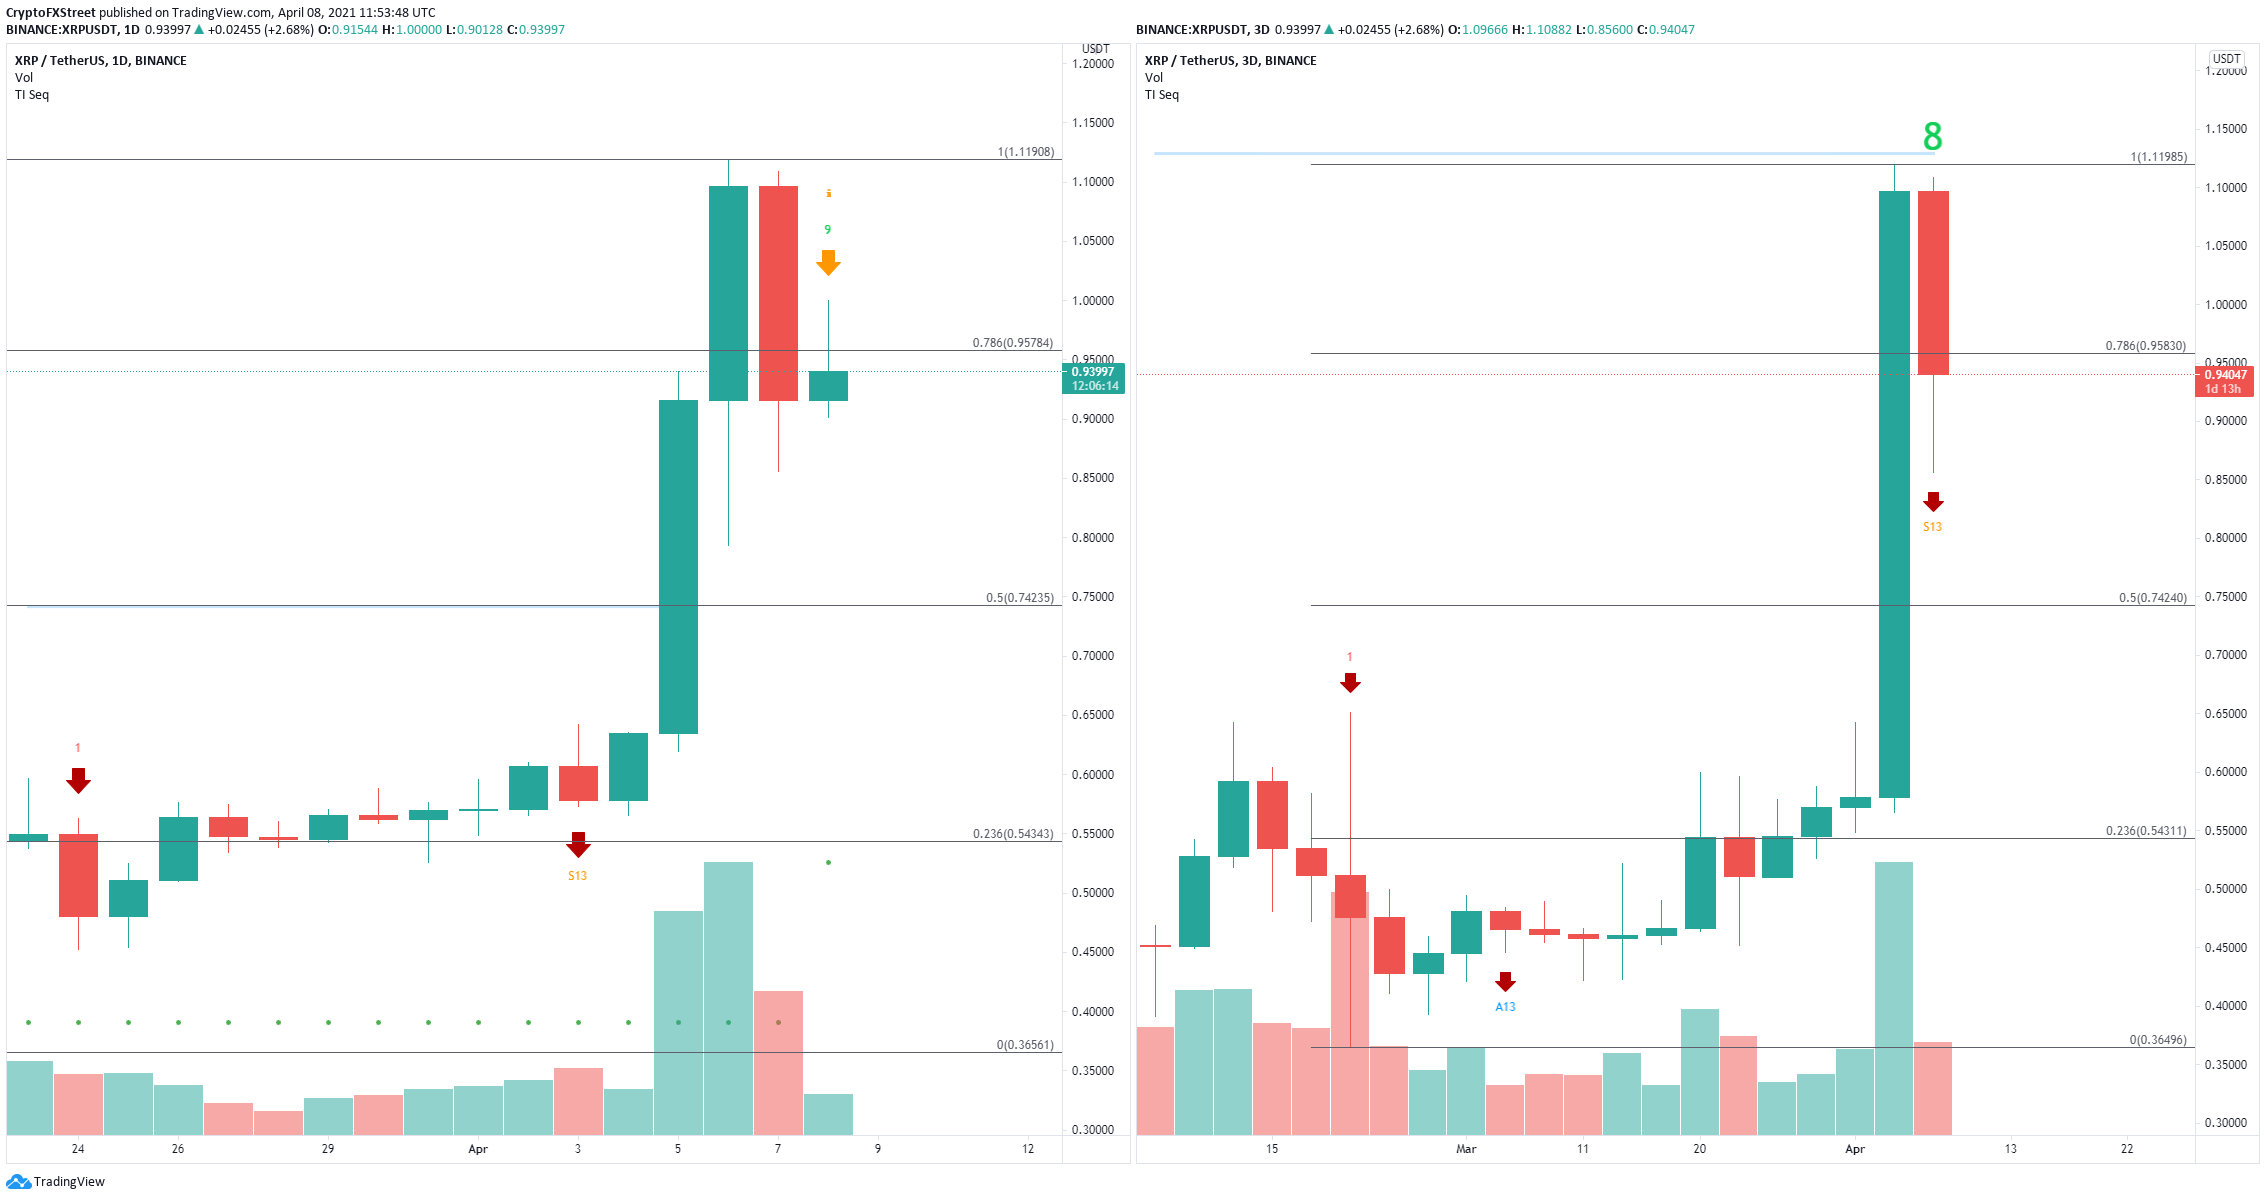
XRP Sell Signals
XRP has lost the 78.6% Fibonacci Retracement level at $0.958, and it is at risk of falling toward the 50% level at $0.742 if both sell signals are confirmed.
Author

Lorenzo Stroe
Independent Analyst
Lorenzo is an experienced Technical Analyst and Content Writer who has been working in the cryptocurrency industry since 2012. He also has a passion for trading.


