Top 3 Price Prediction Bitcoin, Ethereum, Ripple: Market stays strong despite yesterday's sell-off
- Once the storm has passed, the real effects are zero at the technical analysis level.
- The impact on sentiment has been great and returns the market to a neutral level.
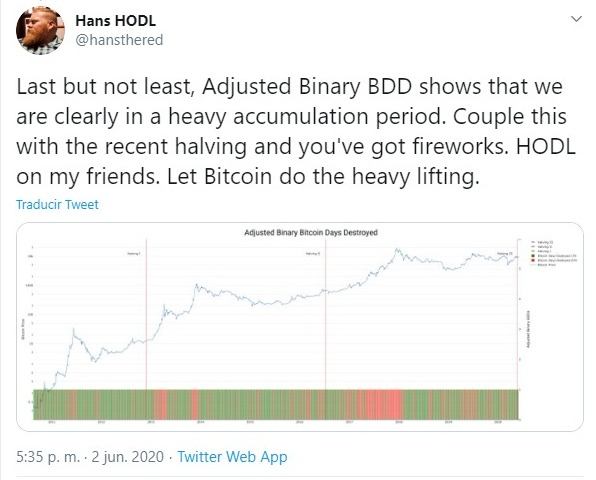
- The market is still in a phase of accumulation, according to a well-known quantitative analyst.

Yesterday at 14:45 GMT, the BTC/USD pair plummeted 7.96% in just 5 minutes, dragging with it the rest of the crypto board and causing a juicy change of hands between the fearful and the convinced.
In the chart below we can see how after Monday night's rally the BTC/USD pair was moving in an optimal zone to reach the only bullish target from the late 2017 highs, to enter again in a clean bullish area.
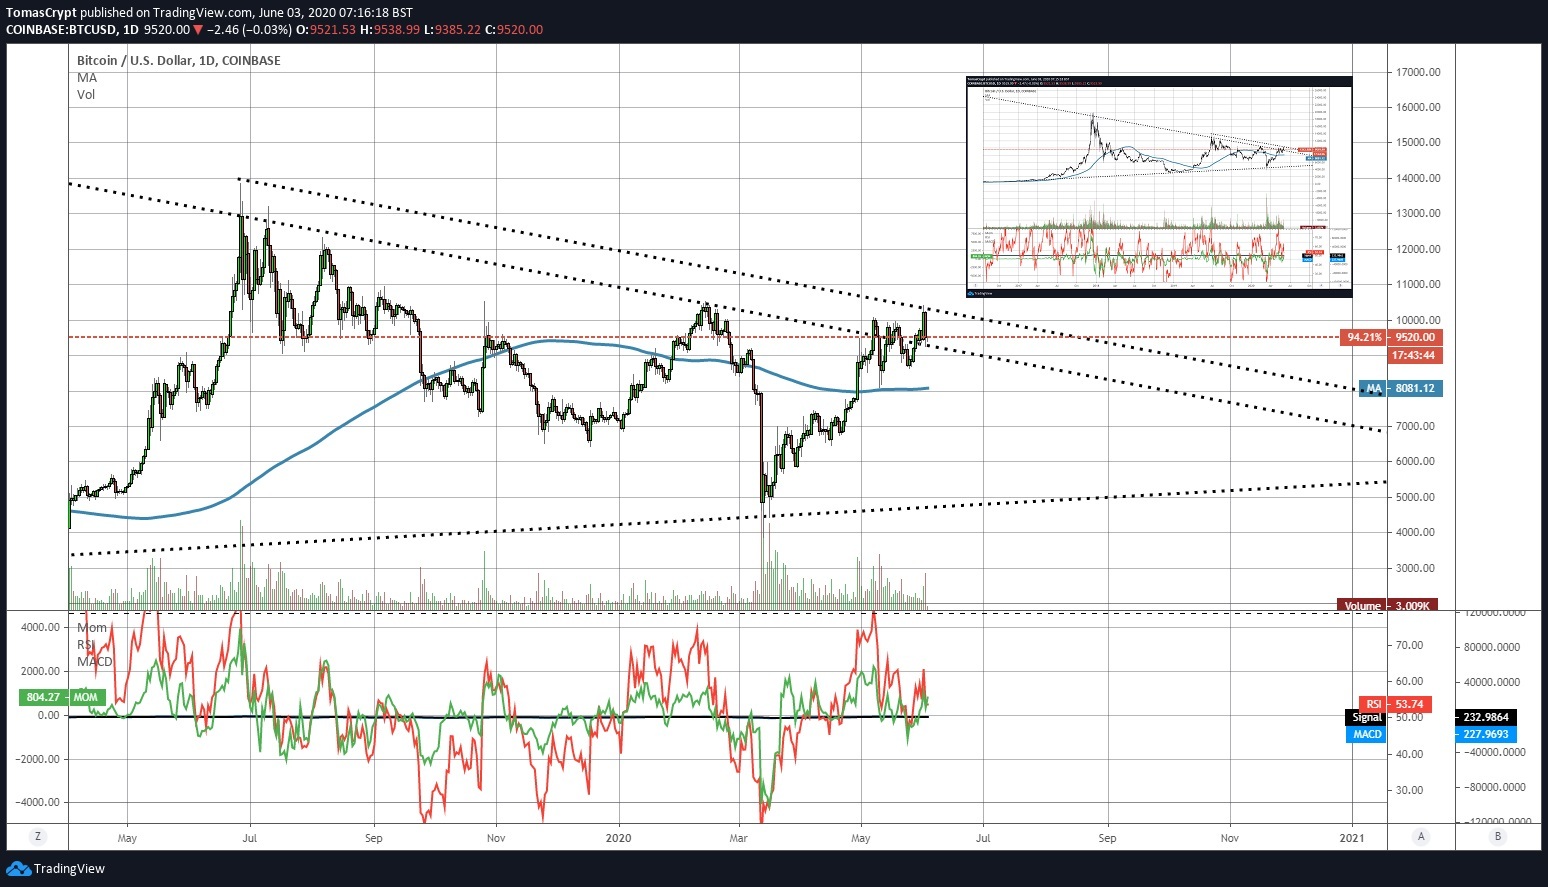
We can also see how despite the sell-off, the technical scenario has not changed at all, and BTC/USD continues to be in the optimal zone to attack the extension of the long-term downward trend line.
Quantitative analyst Hans HODL – famous for his well-founded Twitter threads – published today a short analysis in which he claims that the market is still in accumulation mode. HODL has observed that when Whales and HODLERS (cryptocurrency buyers with a long-term time horizon) coincide in going out to buy, the market finds ground and is ready to continue rising.
Where yesterday's furious move also had no impact was in the particular battle for dominance between Ethereum and Bitcoin.
The Ether's dominance chart shows that the project led by Vitalik Buterin is still in the optimal position to overcome the last resistance that separates it from the fully bullish area on the chart.
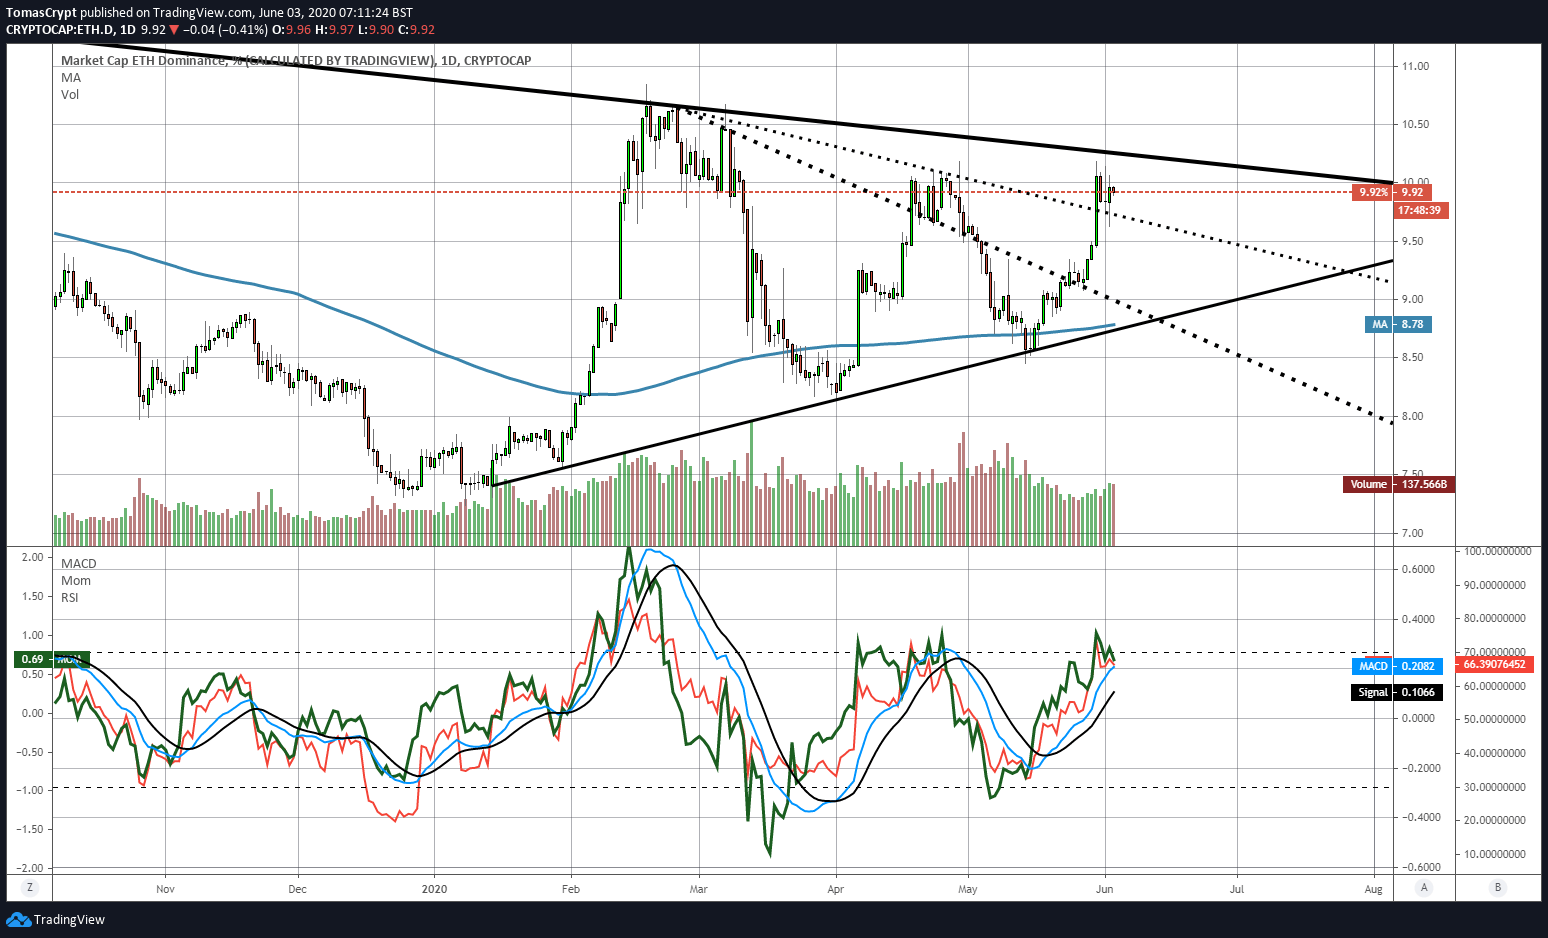
The market needs Altcoins to continue to outperform the Bitcoin, as it would indicate that the market continues to take risk positions by leveraging against the BTC.
Where yesterday's massive sell-off has had an impact is in the crypto market sentiment level, with a sharp contraction that takes it back below the 50 levels but not yet entering into levels considered to be fearful.
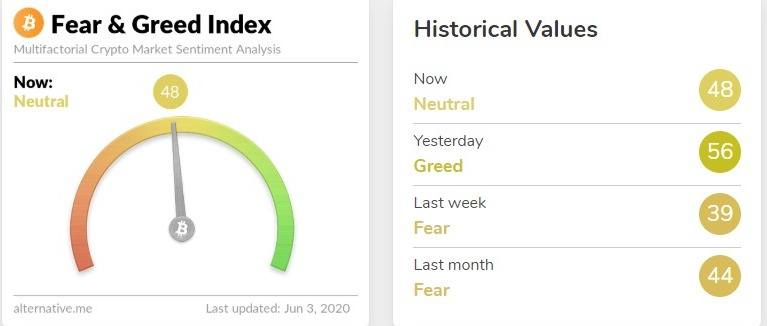
Source: alternative.me
ETH/BTC Daily Chart
The ETH/BTC pair is currently trading at the price level of 0.0248 and reflects the strength of Ethereum over Bitcoin. The sell-off has not conditioned the favourable positioning on risk, and money has continued to come in.
Above the current price, the first resistance level is at 0.025, then the second at 0.0258 and the third one at 0.0268.
Below the current price, the first support level is at 0.0231, then the second at 0.0228 and the third one at 0.022.
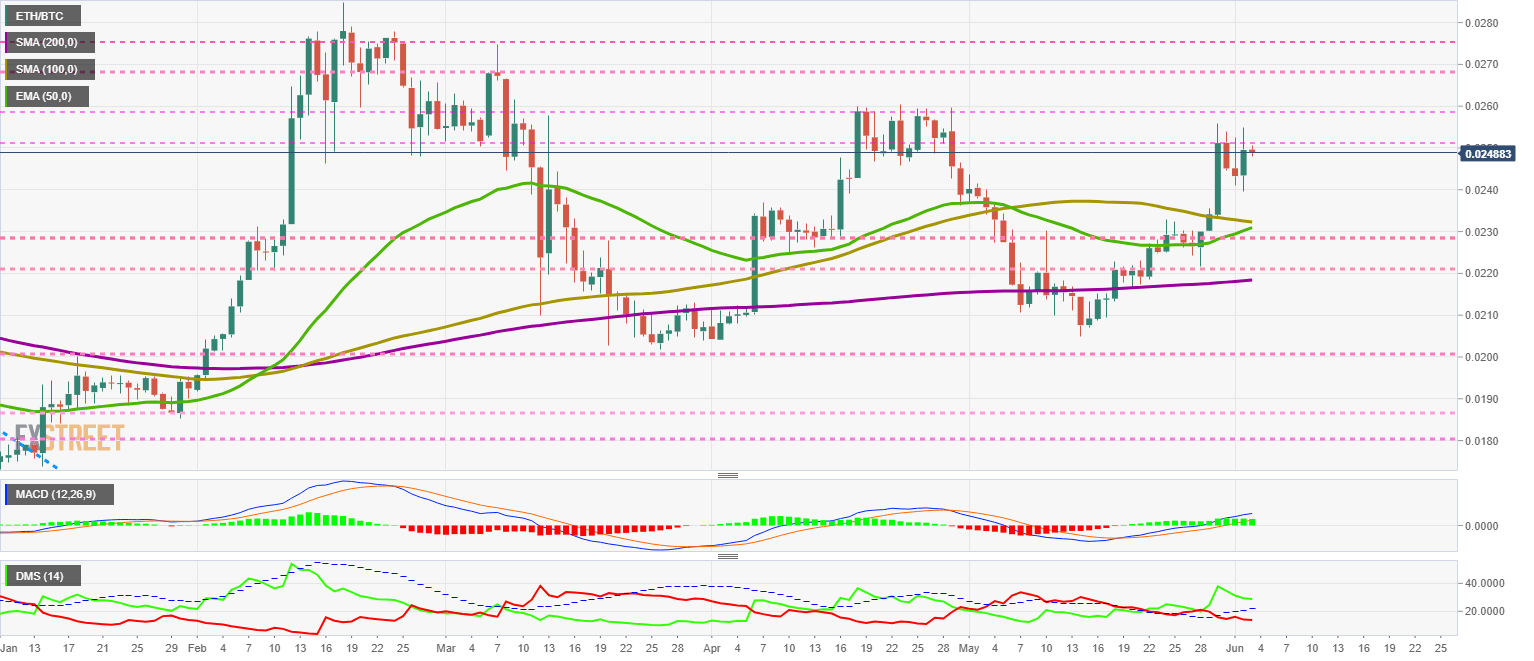
The MACD on the daily chart remains unchanged from the previous bullish trend. Moving averages are entering the positive zone of the indicator and promise further gains in the coming days.
The DMI on the daily chart shows the bulls regaining strength after a couple of days of bearish trading. The bears have also seen no opportunity in the turbulence and continue to move lower.
BTC/USD Daily Chart
The BTC/USD pair is currently trading at $9501, the same level where yesterday's carnage ended. BTC has little margin under it, with very fragile support at $9378.
Above the current price, the first resistance level is at $9700, then the second at $10200 and the third one at $10650.
Below the current price, the first support level is at $9378, then the second at $9150 and the third one at $8800.
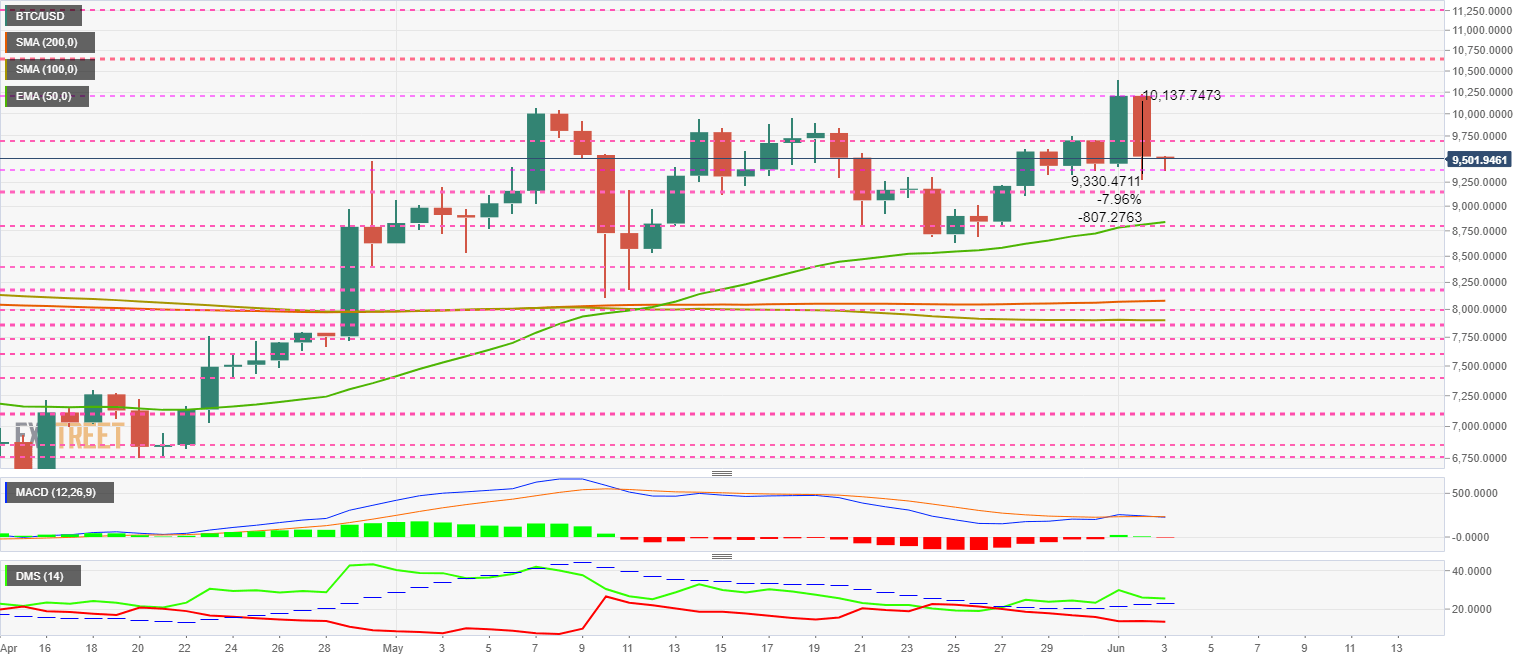
The MACD on the daily chart is crossing back down again. The slight averages inclination avoid a visualization of the development in the short term.
The DMI on the daily chart shows bulls looking for support for the ADX line. The bears are still down and do not see yesterday's selling as an opportunity to contest the leadership of the BTC/USD pair.
ETH/USD Daily Chart
The ETH/USD pair is currently trading at the $236.1 price level and remains in the same price zone as it was before the sell-off.
Above the current price, the first resistance level is at $250, then the second at $260 and the third one at $290.
Below the current price, the first support level is at $235, then the second at $230 and the third one at $225.
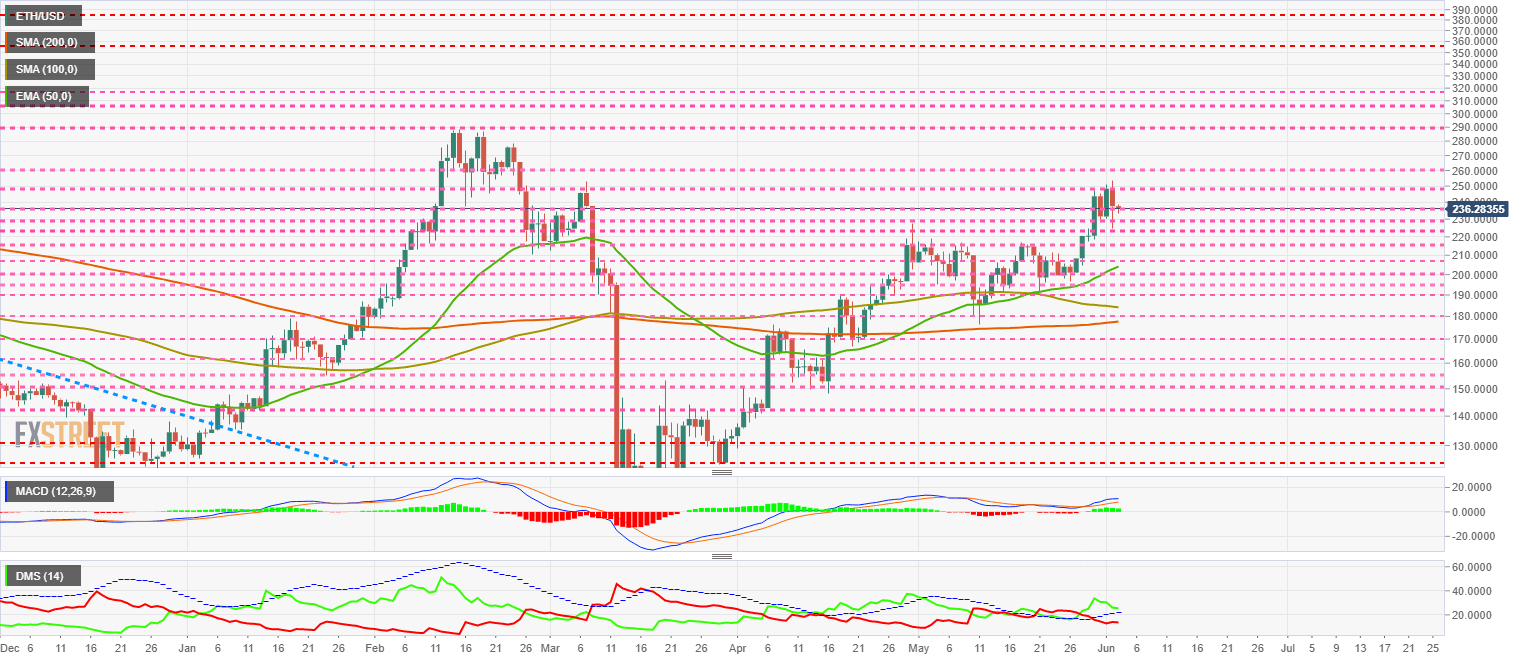
The MACD on the daily chart shows a slight loss of strength but maintains an appropriate bullish profile to continue to see price increases in the coming days.
The DMI on the daily chart shows bulls looking for support at the ADX line, from where it should bounce back up. The bears do seem to see some possibility of taking the lead in the case of ETH/USD.
XRP/USD Daily Chart
The XRP/USD pair is currently trading at a price level of $0.202. If the Ripple had been the least upwardly mobile member of the Top 3 these weeks, it was the least downwardly mobile yesterday. The price remains in the same zone between resistance zones while finding support in the 50-day exponential moving average.
Above the current price, the first resistance level is at $0.215, then the second at $0.238 and the third one at $0.253.
Below the current price, the first support level is at $0.20, then the second at $0.19 and the third one at $0.18.
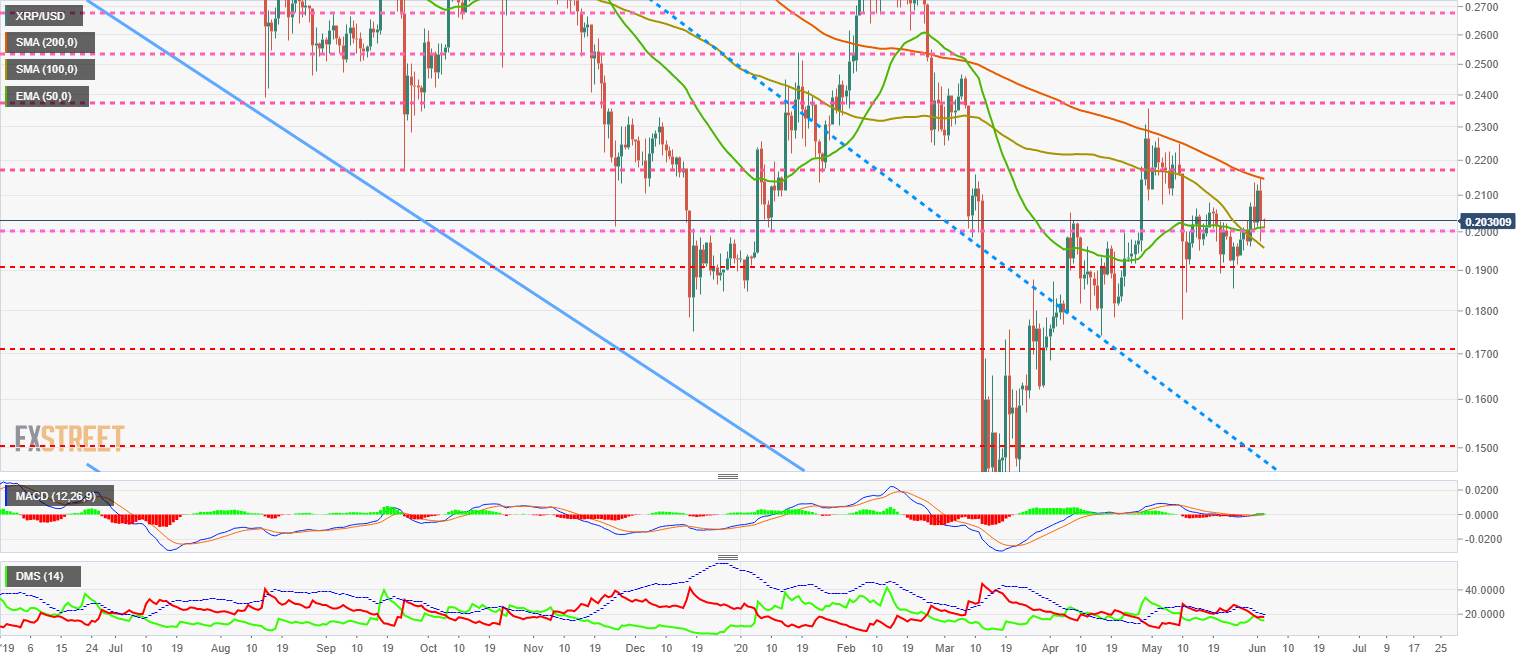
The MACD on the daily chart shows a completely flat profile and is in the neutral zone of the indicator. The current structure conveys only one idea; there is no visibility for the XRP/USD pair in any time frame.
The DMI on the daily chart shows bears taking a minimal lead over bulls, though insufficient to claim any control over the future price of the Ripple.
Author

Tomas Salles
FXStreet
Tomàs Sallés was born in Barcelona in 1972, he is a certified technical analyst after having completing specialized courses in Spain and Switzerland. He expanded his technical training following the guidance of great experts on the financial markets.


