Top 3 Price Prediction Bitcoin, Ethereum, Ripple: Major coins set in motion, BTC jumps above $9,300
- Bitcoin's technical picture has improved after a move above $9,200
- The crypto market sets I'm motion after a prolonged period of consolidation.
- ETH/BTC resumes the upside move, still below $0.0260.

The market has attempted recovery from the lethargic stance that has been dominating the start of the week. Bitcoin and all major altcoins moved above recent congestion levels; however, it is not clear if the upside momentum is a new reality of a dead-cat bounce The market struggles to find the right direction of the next move amid a high level of uncertainty. Bitcoin dominance returned above 62.00%; however, the second-tier altcoins continue outperforming the market. Bitcoin's volatility dropped to the lowest level in more than two years, which may be a precursor to sharp movements if history is any guide.
At the opening of the European session, Bitcoin is hovering above $9,300, having gained 1.8% since the start of the day. Ethereum settled above $240.00 after a short-lived dive to $235.00, while XRP is changing hands at $0.1990.
Syscoin (SYS) is the best-performing asset out of top-100 with nearly 170% of gains on a day-to-day basis. The coin with the current market value of $85 million takes the 91st place in the global cryptocurrency market rating.
Stock markets edged higher on global stimulus measures. EU leaders reach a deal on 750 billion-euro recovery fund, however, the experts warn that the market may be vulnerable to a sharp correction.
The market, particularly tech stocks, is rallying on both good news and bad news, which tells us it’s all about momentum and not about the facts. There are concerns we could see significant pullbacks before we make further gains, but at the moment you can’t stand in front of the train that is the Nasdaq 100 Index, Michael McCarthy, chief market strategist at CMC Markets Asia Pacific Pty, commented as cited by Bloomberg.
ETH/BTC Daily Chart

ETH/BTC is currently trading at 0.02598. The cross settled above the upward-looking middle line of the daily Bollinger Band at $0.0257, which now serves as a local support. ETH/BTC attempted a recovery above 0.026, but failed to hold the ground so far. The 50-day Simple Moving Average has flattened at 0.02522. If it is broken, the price may drop to 0.024 with 100-day located above this area.
Above the current price, the first resistance level is at 0.02600, then the second at 0.0264 and the third one at 0.0270.
Below the current price, the first support level is at 0.02557, then the second at 0.02572 and the third one at 0.0250.
BTC/USD Daily Chart
BTC/USD is currently trading at $9,330. The first digital coin jumped above $9,200 after several days of range-bound trading. Since the start of the day, BTC/USD has gained nearly 2% amid strong bullish momentum. A sustainable move above $9,200 improved the short-term picture, while a critical support is still created by the psychological barrier of $9,000. The upward-looking 100-day SMA reinforces the channel support and separates the coin from an extended sell-off towards 200-day SMA at $8,550 zone.
Above the current price, the first resistance level is at $9,500, then the second at $10,000 and the third one at $10,400.
Below the current price, the first support level is at $9,000, then the second at $8,550 and the third one at $8,400.
ETH/USD Daily Chart
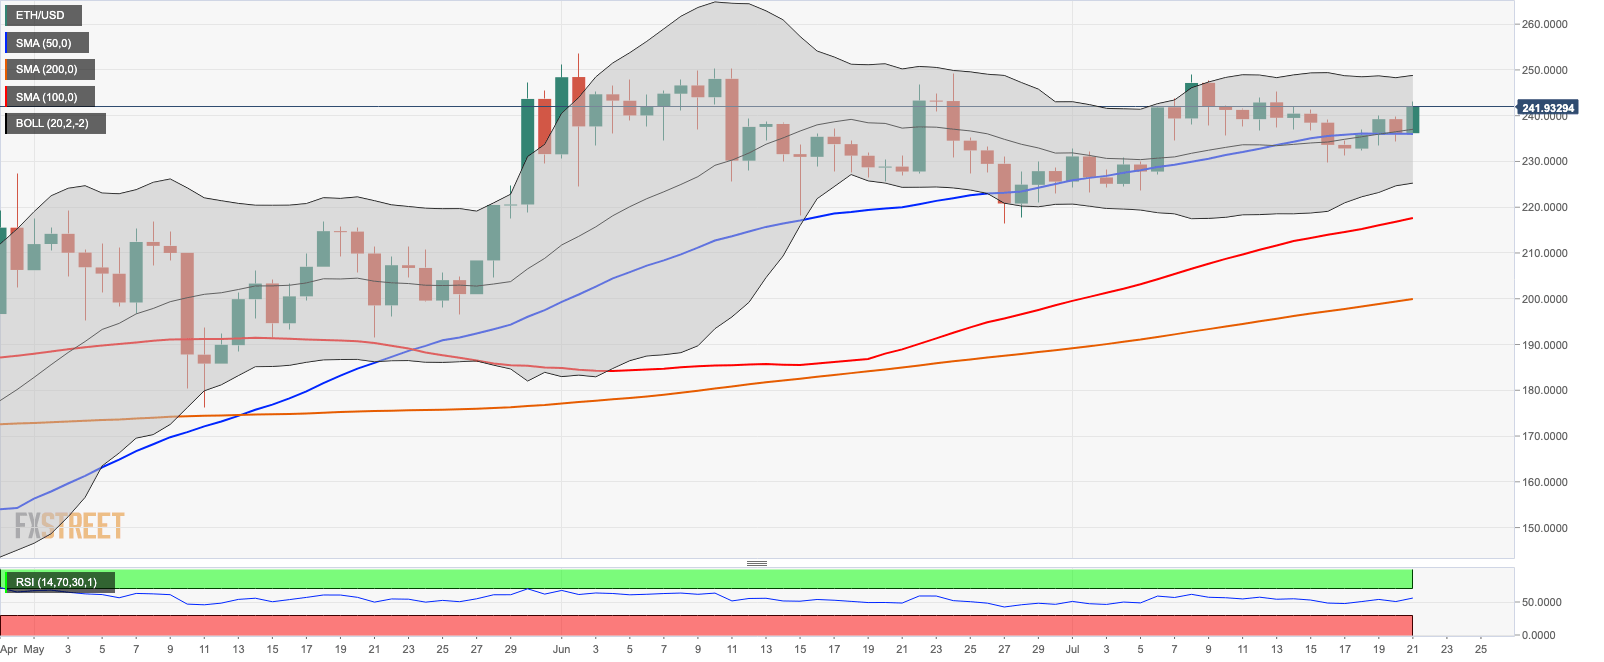
ETH/USD is currently trading at $242 supported by the 50-day SMA coupled with the middle line of the daily Bollinger Band on approach to $236. If it is broken, the downside momentum may gain traction and push the price towards 100-day SMA100 at $217; however, the critical support is created by 200-day simple moving average on approach to $200 level, which is unlikely to be taken out from the first attempt. On the upside, the next resistance is created by the upper line of the daily Bollinger Band at $248.
Above the current price, the first resistance level is at $260, then the second at $270 and the third one at $300.
Below the current price, the first support level is at $240, then the second at $200 and the third one at $185.
XRP/USD Daily Chart
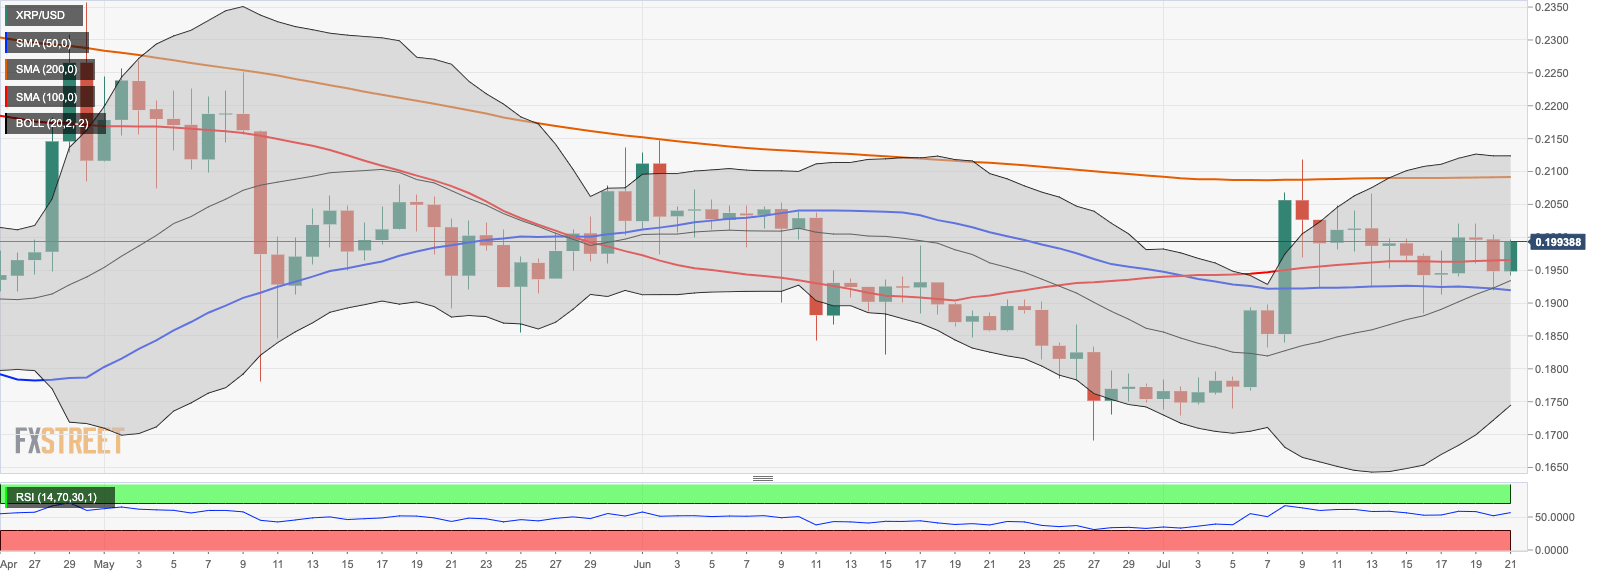
XRP/USD is currently trading at $0.1980. The coin has regained the ground above 100-day SMA that was lost during Monday trading. However, despite the recovery, the price continues moving within the long-term bearish trend from the recent high of $0.2056 (July 9). A sustainable move above $0.2020 (July 19 recovery high) is needed for the upside to gain traction. The 100-day SMA at $0.1965 serves as an initial support level that may slow down the bears and initiate the recovery towards psychological $0.2000 followed by the above-mentioned $0.2020. Once it is out of the way, the upside is likely to gain traction with the next focus on 200-day SMA on approach t0 $0.2100.
Above the current price, the first resistance level is at $0.2000, then the second at $0.2020 and the third one at $0.21.
Below the current price, the first level of support is at $0.1965, then the second at $0.1900 and the third one at $0.1800.
Author

Tanya Abrosimova
Independent Analyst


