Top 3 Price Prediction Bitcoin, Ethereum, Ripple: Crypto market rocking the cradle
- The current levels of resistance split opposite scenarios in the medium term.
- Ether reasserts himself as a leader, XRP as a lagger.
- Bitcoin is still the king and can play its trump card at any time.

The cryptocurrency market continues with its already typical endless pauses. This pattern is emphasizing even more that bipolarity of behaviour between the halt and the action.
The high volatility with which the crypto segment moves at certain times collapses before crucial technical levels.
Now is one of those moments that will determine the development of the market in the coming weeks, with bulls and bears facing each other for the control of Bitcoin price.
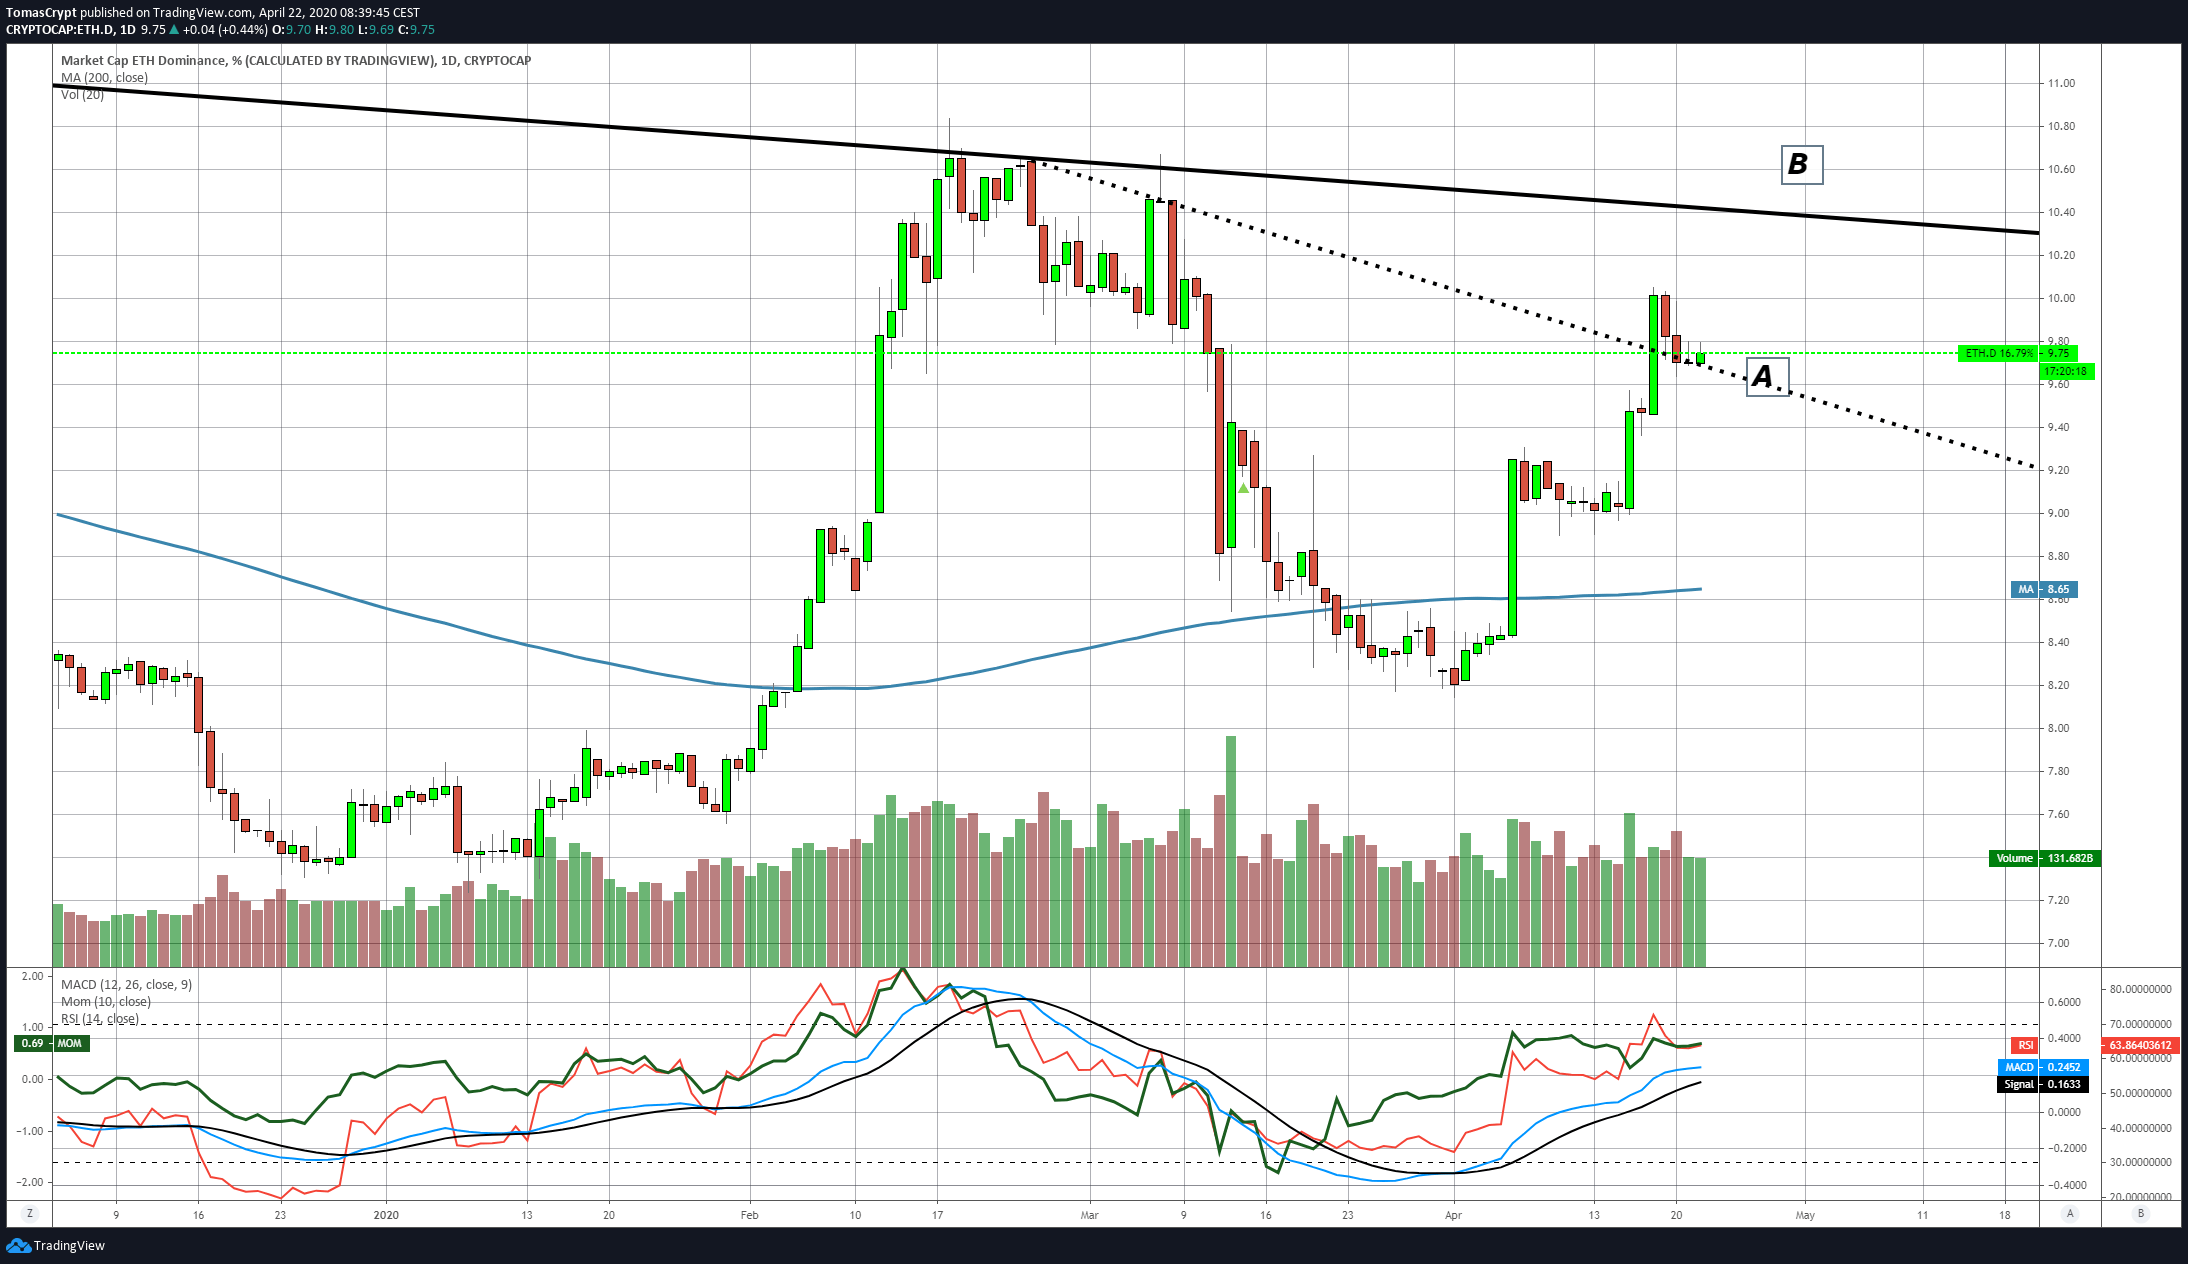
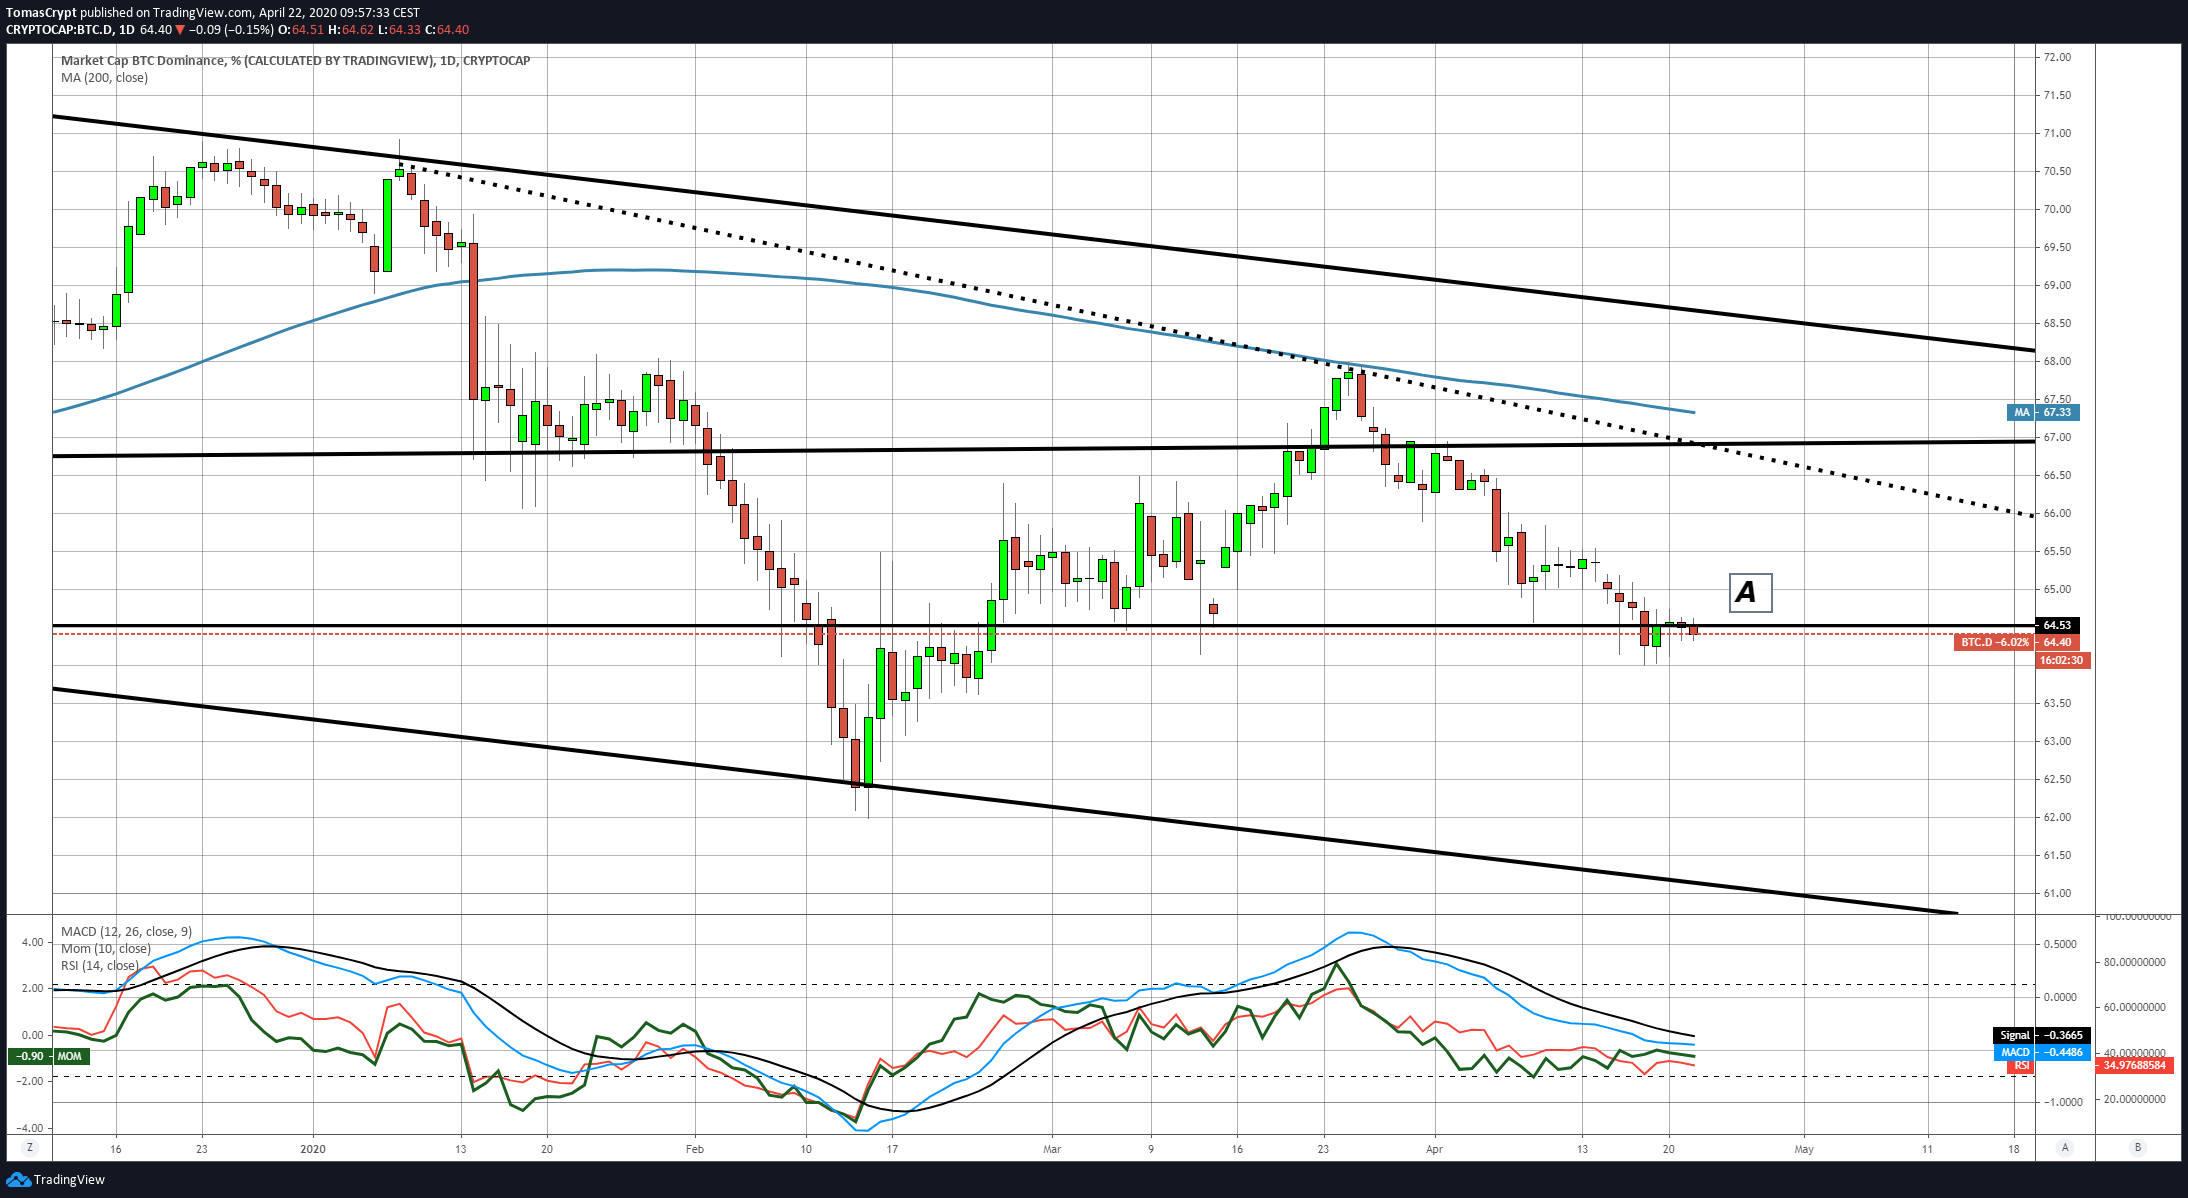
The Bitcoin and Ether dominance charts are also at critical points that can be in favour of one or the other.
The Bitcoin dominance chart shows that the current level at 64.5 (A), was already significant in the past. Specifically in the Spring and Fall of 2017 and also in the Summer of 2019. As early as 2020, this same support level had implications for the end of the crypto market's upward trend and its subsequent decline.
ETH/BTC Daily Chart
The ETH/BTC pair is currently trading at the price level of 0.0251 and is having trouble breaking through the price congestion resistance level at 0.0255. The main moving averages continue to increase the bullish profile and offer important but distant support at the 0.023 level.
Above the current price, the first resistance level is at 0.0255, then the second at 0.0268 and the third one at 0.0275.
Below the current price, the first support level is at 0.023, then the second at 0.0222 and the third one at 0.0214.
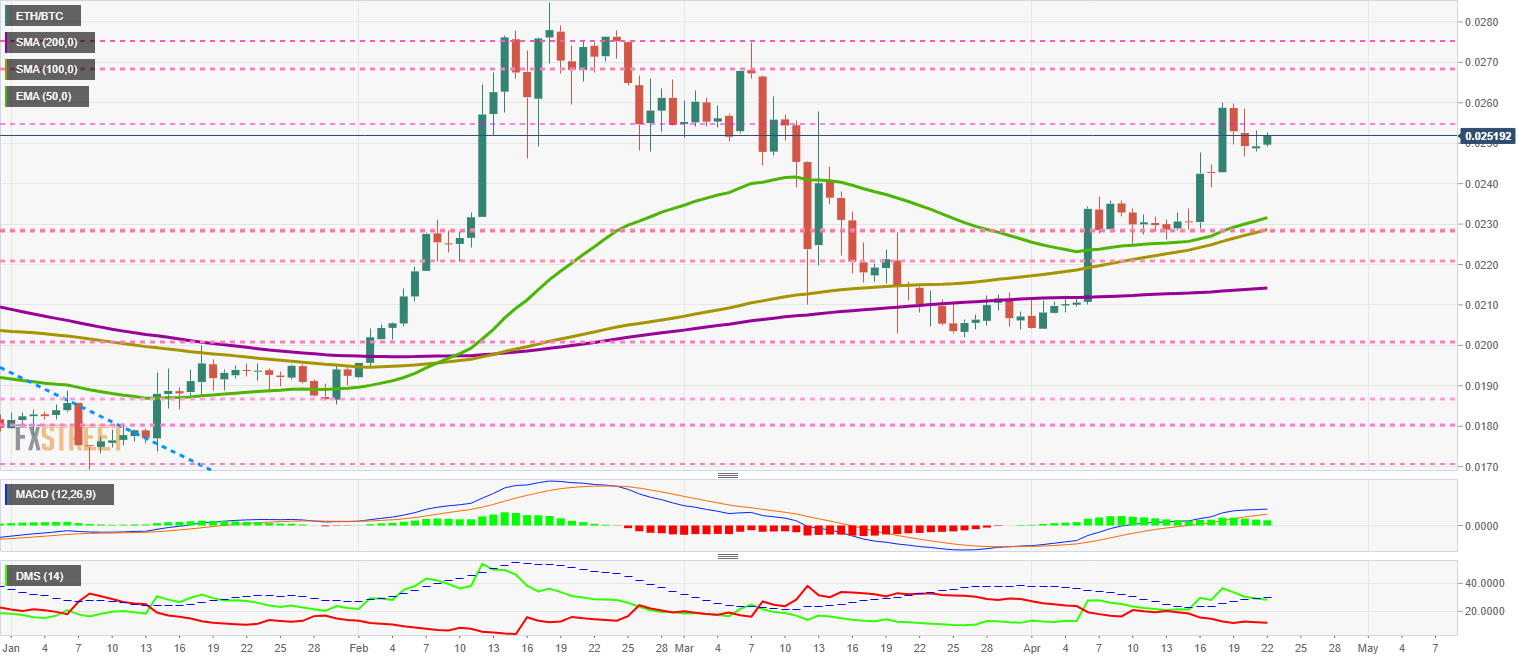
The MACD on the daily chart loses its bullish profile and moves sideways while the exponential average and the signal line get closer. This setup is not a good structure for an upside attempt.
The DMI on the daily chart shows bulls losing support from the ADX line, which could disable the bullish momentum of the ETH/BTC pair if the daily close confirms this downward break.
BTC/USD Daily Chart
The BTC/USD pair is currently trading at the price level of $6968 and remains in the optimal zone to attack the long-term bearish channel ceiling at the price level of $7090. The resistance level worsened by the presence of the EMA50 at the same price level. As if that wasn't enough resistance to the Bitcoin advance, there are multiple price congestion resistance, trend lines, and significant moving averages up to and beyond $8000.
Above the current price, the first resistance level is at $7100, then the second at $7400 and the third one at $7800.
Below the current price, the first support level is at $6700, then the second at $6600 and the third one at $6400.
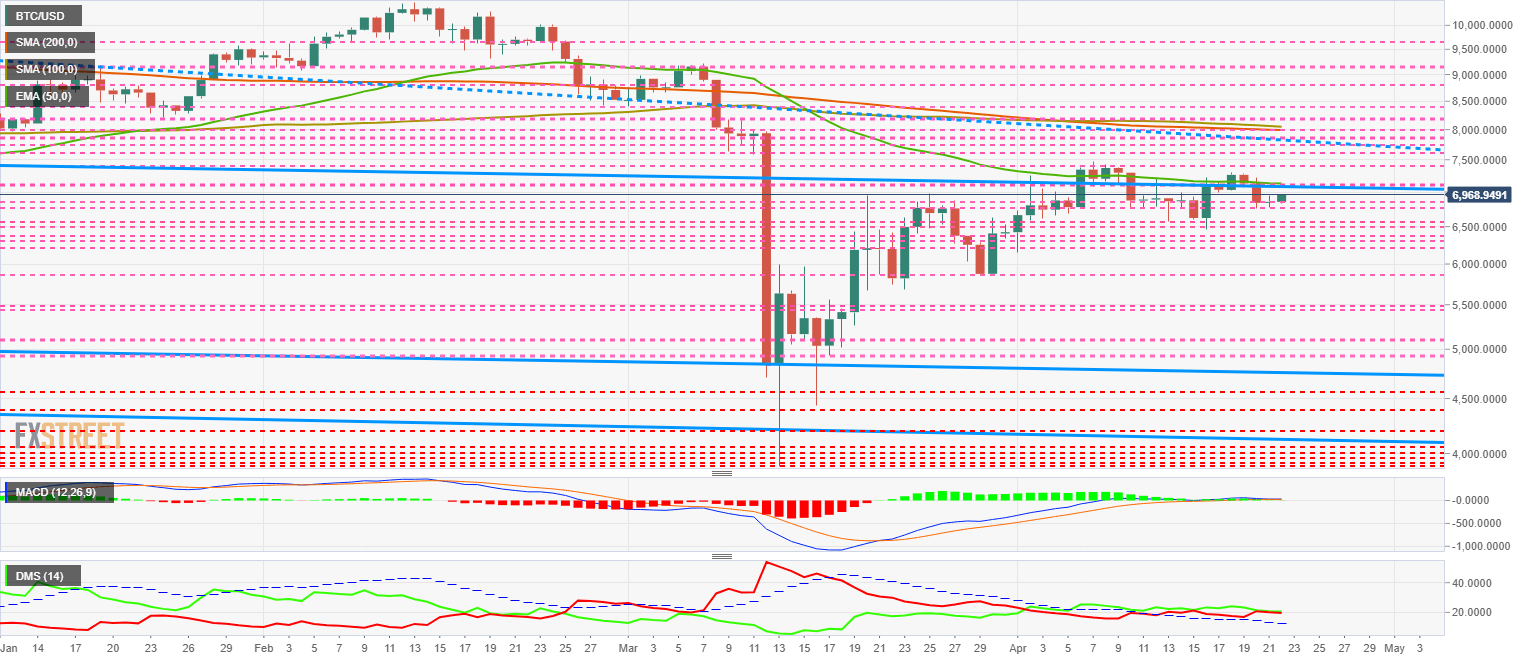
The MACD on the daily chart shows a further day's indicator that lacks direction and strength. Only the presence of support level 0 provides some confidence at the current time.
The DMI on the daily chart clearly expresses the situation I mentioned at the beginning of this article. Both sides of the market have been at similar levels for more than three days, and neither bears nor bulls can take control of the BTC/USD pair.
ETH/USD Daily Chart
The ETH/USD pair is currently trading at the $176 price level and is moving above the SMA200 today. The main moving averages are also increasing the bullish profile and accompanying the Ether price upwards. The critical level to break out of the bullish trend is at $190.
Above the current price, the first resistance level is at $185.7, then the second at $190 and the third one at $195.
Below the current price, the first support level is at $170, then the second at $165 and the third one at $162.
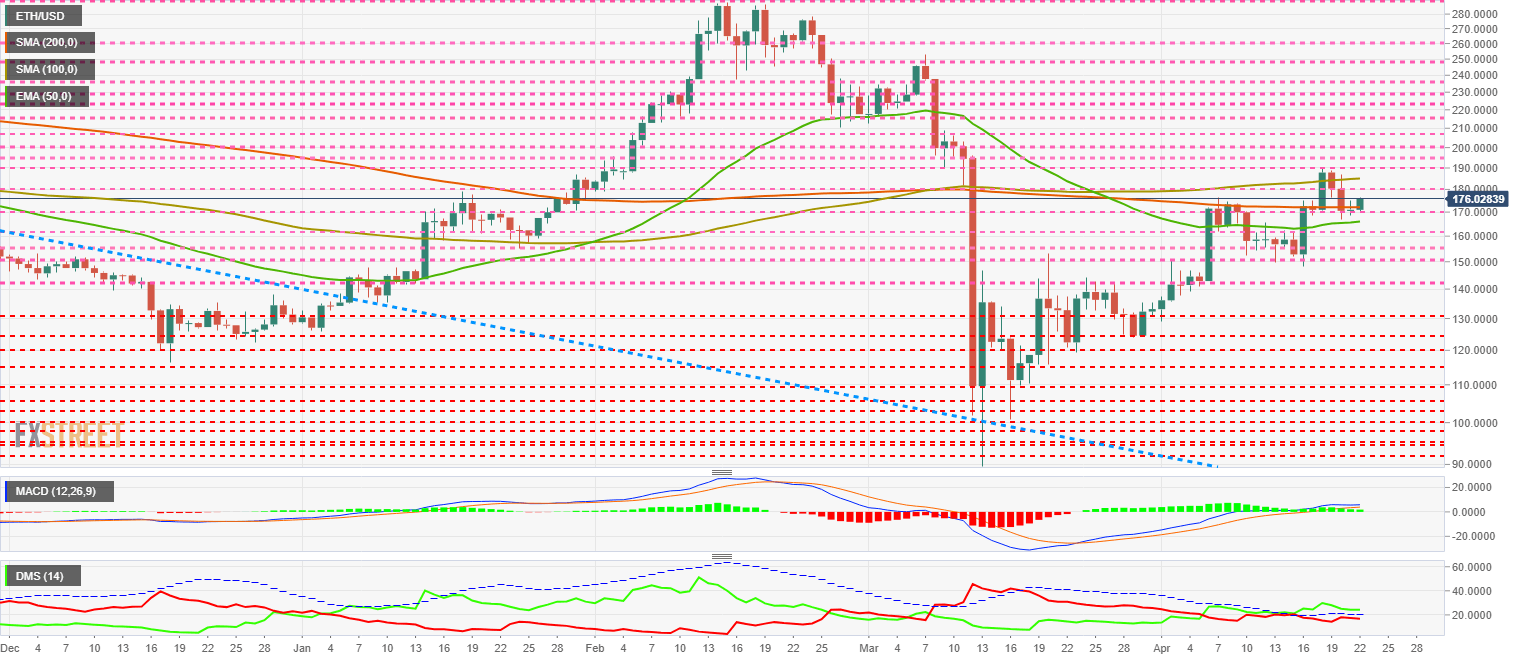
The DMI on the daily chart shows the bulls are weakly controlling ETH/USD, while the bears are retreating today after yesterday's breakout attempt.
XRP/USD Daily Chart
The XRP/USD pair is currently trading at a price level of $0.186 and is pointing to the current positive tone in the crypto market. The main moving averages continue to slide down, complicating the upward development for the Ripple Ltd. token.
Above the current price, the first resistance level is at $0.19, then the second at $0.20 and the third one at $0.22.
Below the current price, the first support level is at $0.181, then the second at $0.171 and the third one at $0.163.
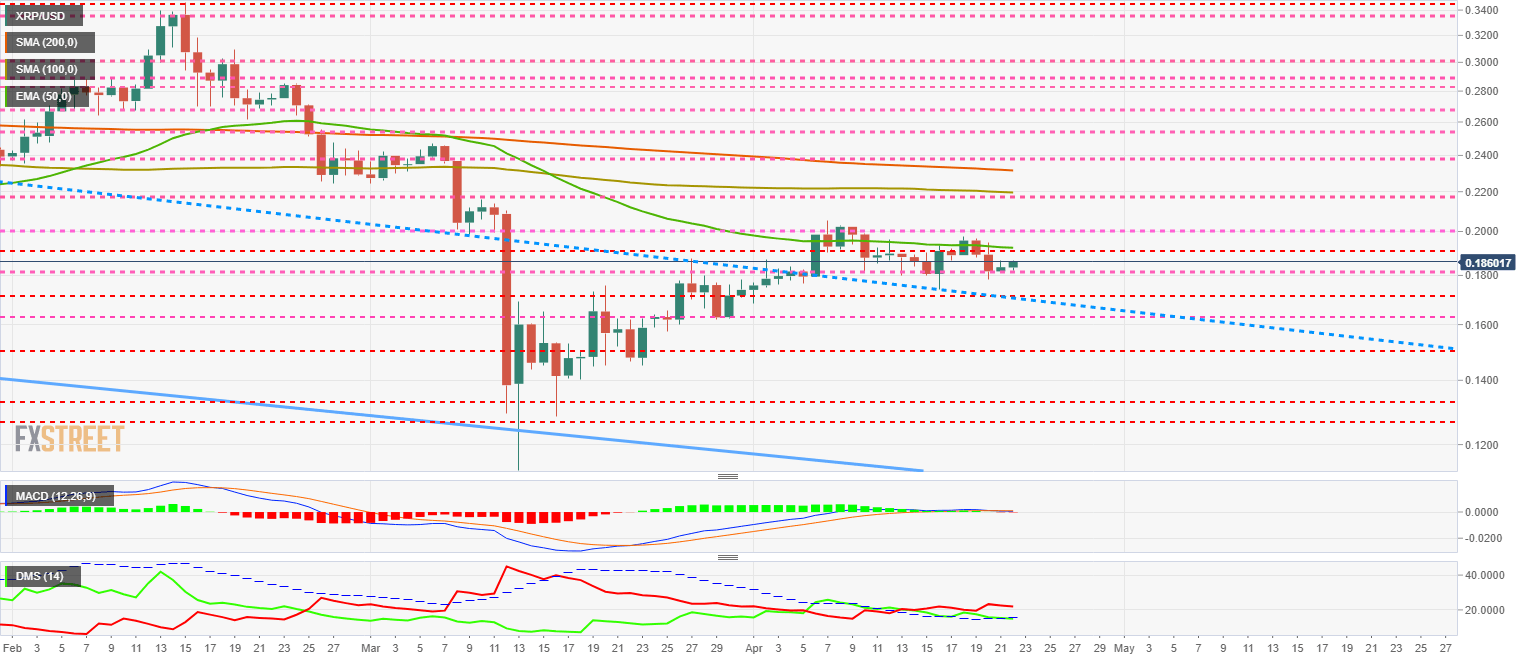
The MACD on the daily chart shows an entirely flat profile with no line spacing. This structure informs the lack of direction and strength in the XRP/USD pair.
The DMI on the daily chart shows the bears reinforcing their control, although more because of the lack of opposition from the bulls.
Author

Tomas Salles
FXStreet
Tomàs Sallés was born in Barcelona in 1972, he is a certified technical analyst after having completing specialized courses in Spain and Switzerland. He expanded his technical training following the guidance of great experts on the financial markets.


