Top 3 Price Prediction Bitcoin, Ethereum, Ripple: Bulls eye further upside as key resistances flip into support
- Bitcoin price rebounds above $109,000 after retesting its breakout from consolidation, signaling renewed bullish momentum.
- Ethereum price finds support around its throwback at $2,461, signaling potential for further upward momentum.
- XRP holds firm at $2.23 support, igniting bullish momentum and paving the way for a potential rally.

Bitcoin (BTC), Ethereum (ETH), and Ripple (XRP) are showing signs of renewed strength as the crypto market kicks off the week on a bullish note. BTC has reclaimed ground above $109,000 after confirming a breakout from its consolidation phase. Meanwhile, ETH and XRP are holding strong near their crucial support levels, signaling potential for further upward momentum.
Will BTC refresh its record highs?
Bitcoin price rebounded after retesting its previous broken upper boundary of a consolidation zone at $108,355 on Friday and rose slightly over the next two days. At the time of writing on Monday, it continues to trade higher above $109,000.
If BTC continues its upward momentum, it could extend the rally toward the May 22 all-time high at $111,980.
The Relative Strength Index (RSI) on the daily chart reads 58, above its neutral level of 50, indicating bullish momentum. The Moving Average Convergence Divergence (MACD) on the daily chart displayed a bullish crossover. It also shows rising green histogram bars above its neutral level, suggesting bullish momentum and indicating an upward trend.
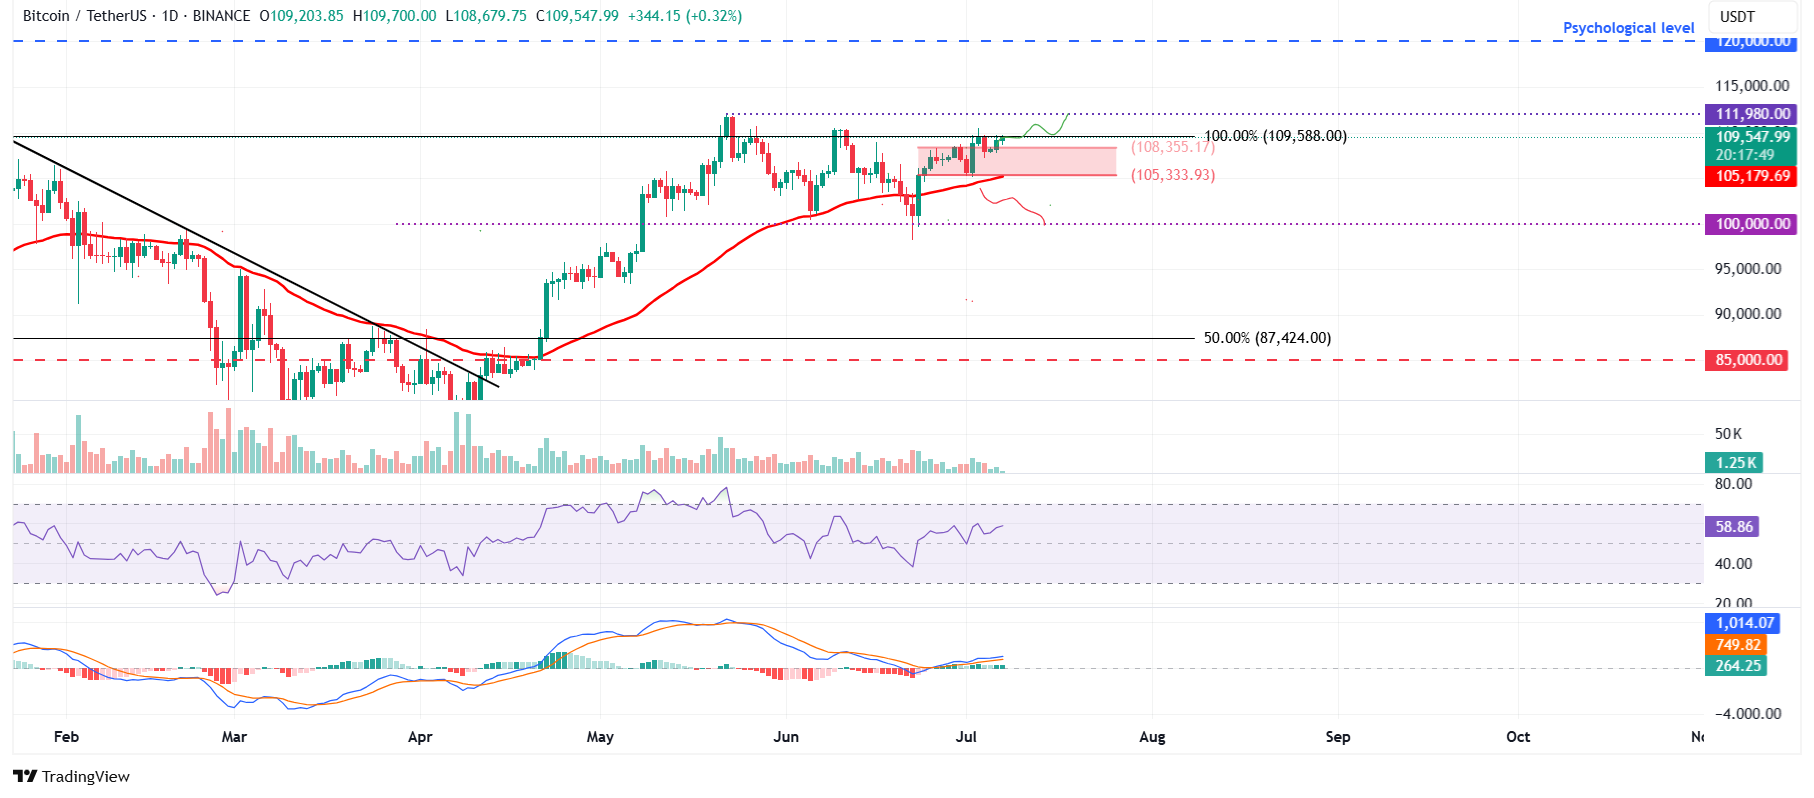
BTC/USDT daily chart
However, if BTC faces a correction and closes below its support at $108,355, it could extend the decline to retest the lower boundary of the consolidation zone at $105,333.
Ethereum rebounds after retesting its key support level
Ethereum price rebounded after finding support around its daily level of $2,461 on Friday and recovered slightly over the weekend. At the time of writing on Monday, it hovers at around $2,576.
If ETH continues its upward trend, it could extend the rally toward its next daily resistance level at $2,724.
The RSI on the daily chart reads 55, above its neutral level of 50, indicating that bullish momentum is gaining traction. The MACD indicator on the daily chart displayed a bullish crossover last week. It also shows rising green histogram bars above its neutral level, suggesting bullish momentum and indicating an upward trend.
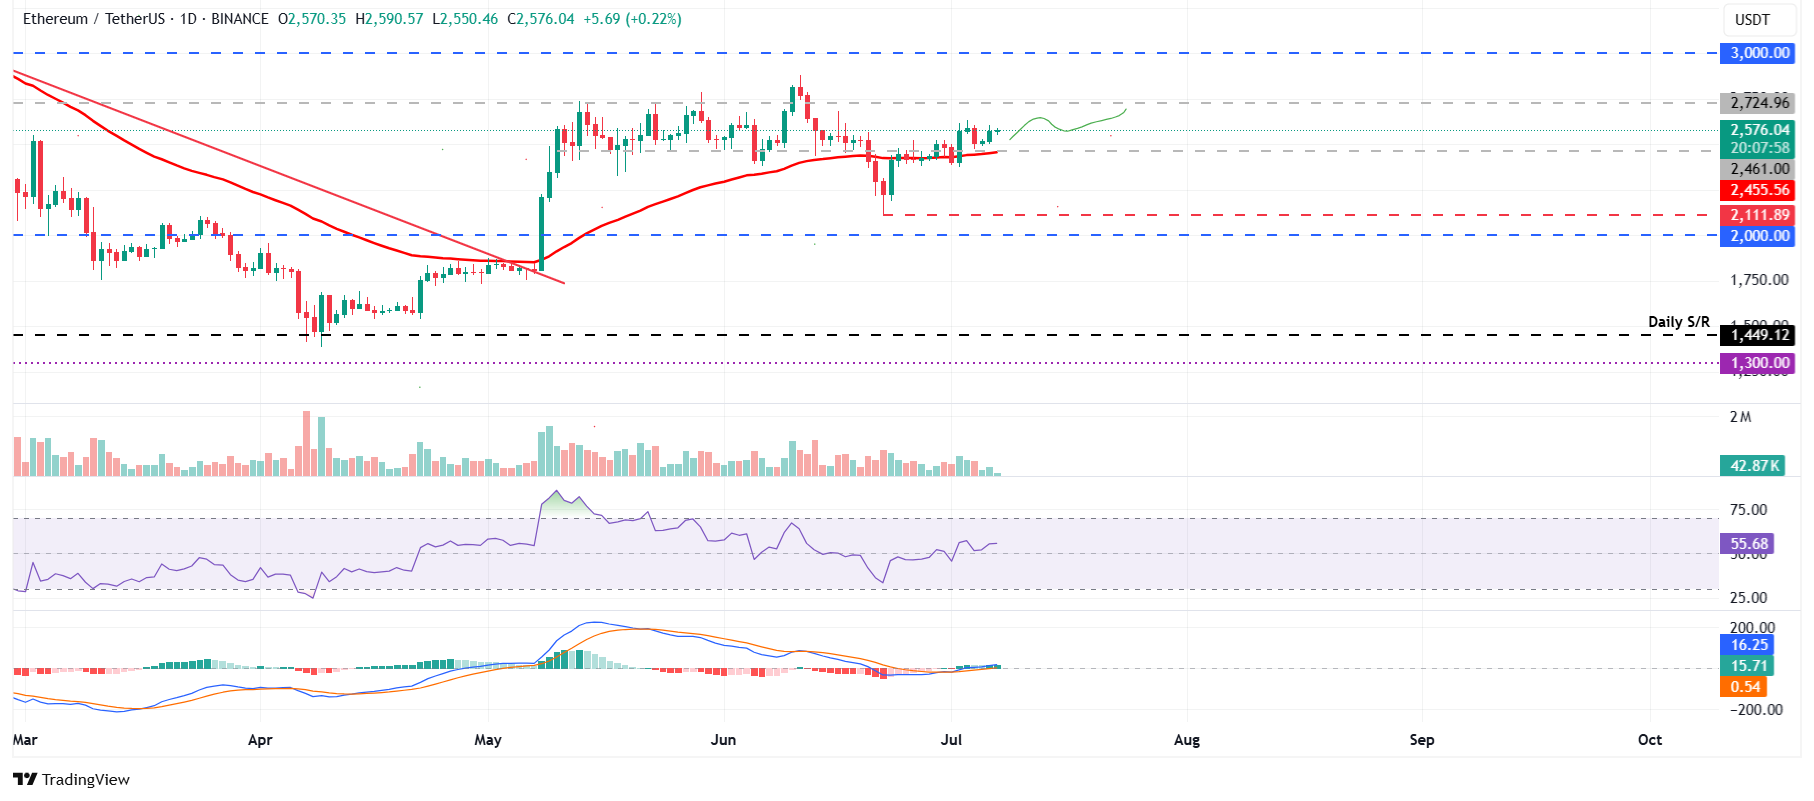
ETH/USDT daily chart
On the other hand, if ETH faces a correction, it could extend the decline to retest its daily support at $2,461.
XRP bulls are aiming for levels above $2.40
XRP price broke above the descending trendline (drawn by connecting multiple highs since mid-May) on June 30 and found support around its previous level over the next two days, rallying 4.5% until Sunday. At the time of writing on Monday, it trades at around $2.27.
If XRP continues its upward momentum, it could extend the rally toward its May 23 high of $2.47.
The RSI on the daily chart reads 56, above its neutral level of 50, indicating that bullish momentum is gaining traction. The MACD indicator on the daily chart displayed a bullish crossover last week. It also shows rising green histogram bars above its neutral level, suggesting bullish momentum and indicating an upward trend.
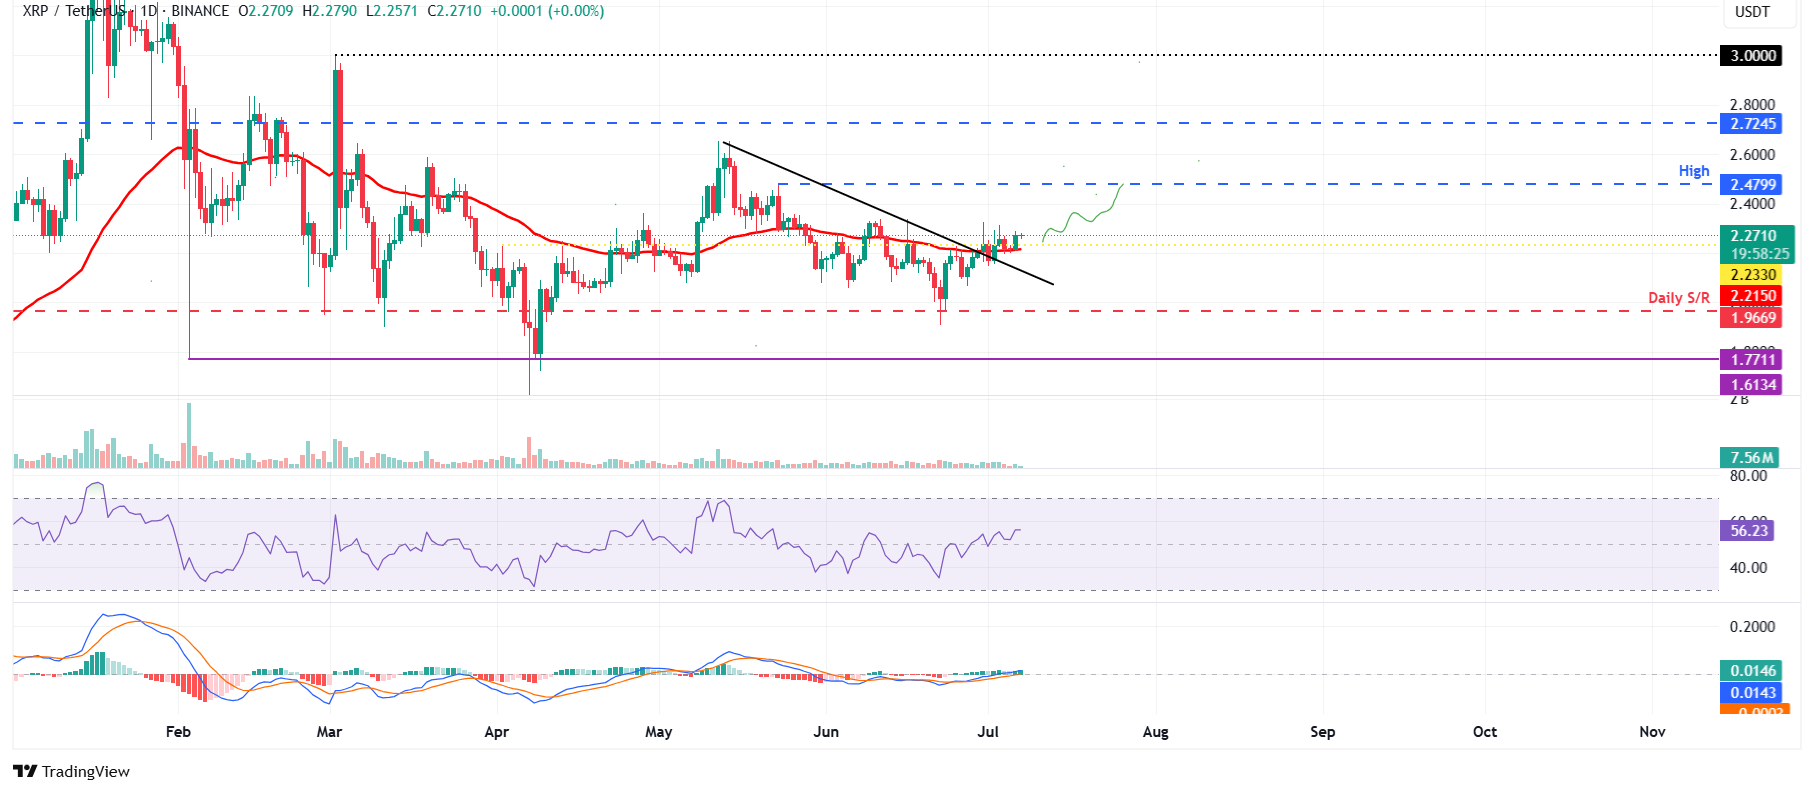
XRP/USDT daily chart
Conversely, if XRP falls and closes below its 50-day EMA at $2.21, it could extend the correction to retest its daily support at $1.96.
Cryptocurrency metrics FAQs
The developer or creator of each cryptocurrency decides on the total number of tokens that can be minted or issued. Only a certain number of these assets can be minted by mining, staking or other mechanisms. This is defined by the algorithm of the underlying blockchain technology. On the other hand, circulating supply can also be decreased via actions such as burning tokens, or mistakenly sending assets to addresses of other incompatible blockchains.
Market capitalization is the result of multiplying the circulating supply of a certain asset by the asset’s current market value.
Trading volume refers to the total number of tokens for a specific asset that has been transacted or exchanged between buyers and sellers within set trading hours, for example, 24 hours. It is used to gauge market sentiment, this metric combines all volumes on centralized exchanges and decentralized exchanges. Increasing trading volume often denotes the demand for a certain asset as more people are buying and selling the cryptocurrency.
Funding rates are a concept designed to encourage traders to take positions and ensure perpetual contract prices match spot markets. It defines a mechanism by exchanges to ensure that future prices and index prices periodic payments regularly converge. When the funding rate is positive, the price of the perpetual contract is higher than the mark price. This means traders who are bullish and have opened long positions pay traders who are in short positions. On the other hand, a negative funding rate means perpetual prices are below the mark price, and hence traders with short positions pay traders who have opened long positions.
Author

Manish Chhetri
FXStreet
Manish Chhetri is a crypto specialist with over four years of experience in the cryptocurrency industry.

