Top 3 Price Prediction: Bitcoin, Ethereum, Ripple – BTC slips under $105K, ETH consolidates, XRP at a crucial support
- Bitcoin extends losses below $105,000 on Thursday, pointing to a bearish reversal pattern.
- Ethereum consolidates within a three-week-long range-bound movement, trading near $2,600.
- XRP trades below $2.20, suggesting a potential pullback to the $2.13 support level.

Bitcoin (BTC) edges lower to near $104,600 at the time of writing on Thursday, while Ethereum (ETH) and Ripple’s (XRP) experience a decline in bullish momentum. BTC and XRP approach a crossroads at crucial support levels, while Ethereum is in consolidation, risking a bearish release of momentum.
Bitcoin risks nosedive to $100K
Bitcoin edges lower on Thursday, dropping from its daily high of $105,240 to $104,546 at press time. With two consecutive bearish candles on the daily chart, BTC is down nearly 1% so far this week.
As the biggest cryptocurrency by market capitalization declines, price action warns of a steeper correction with a Head-and-Shoulders pattern looming, as shared below. The neckline is at $102,315, and a potential daily close below this could catalyze a fall to $100,000.
In case of extended pullback, the immediate support lies at the 50-day Exponential Moving Average (EMA) at $100,946.
Supporting the bearish outlook, the momentum indicators project a loss in buying pressure. The Relative Strength Index (RSI) at 50 touches down the halfway level for the second time since Friday, suggesting a significant drop in bullish momentum, while massive room for correction exists.
Further up, the Moving Average Convergence/Divergence (MACD) indicator triggers a bearish signal as its average lines fall towards the center line after a recent crossover.
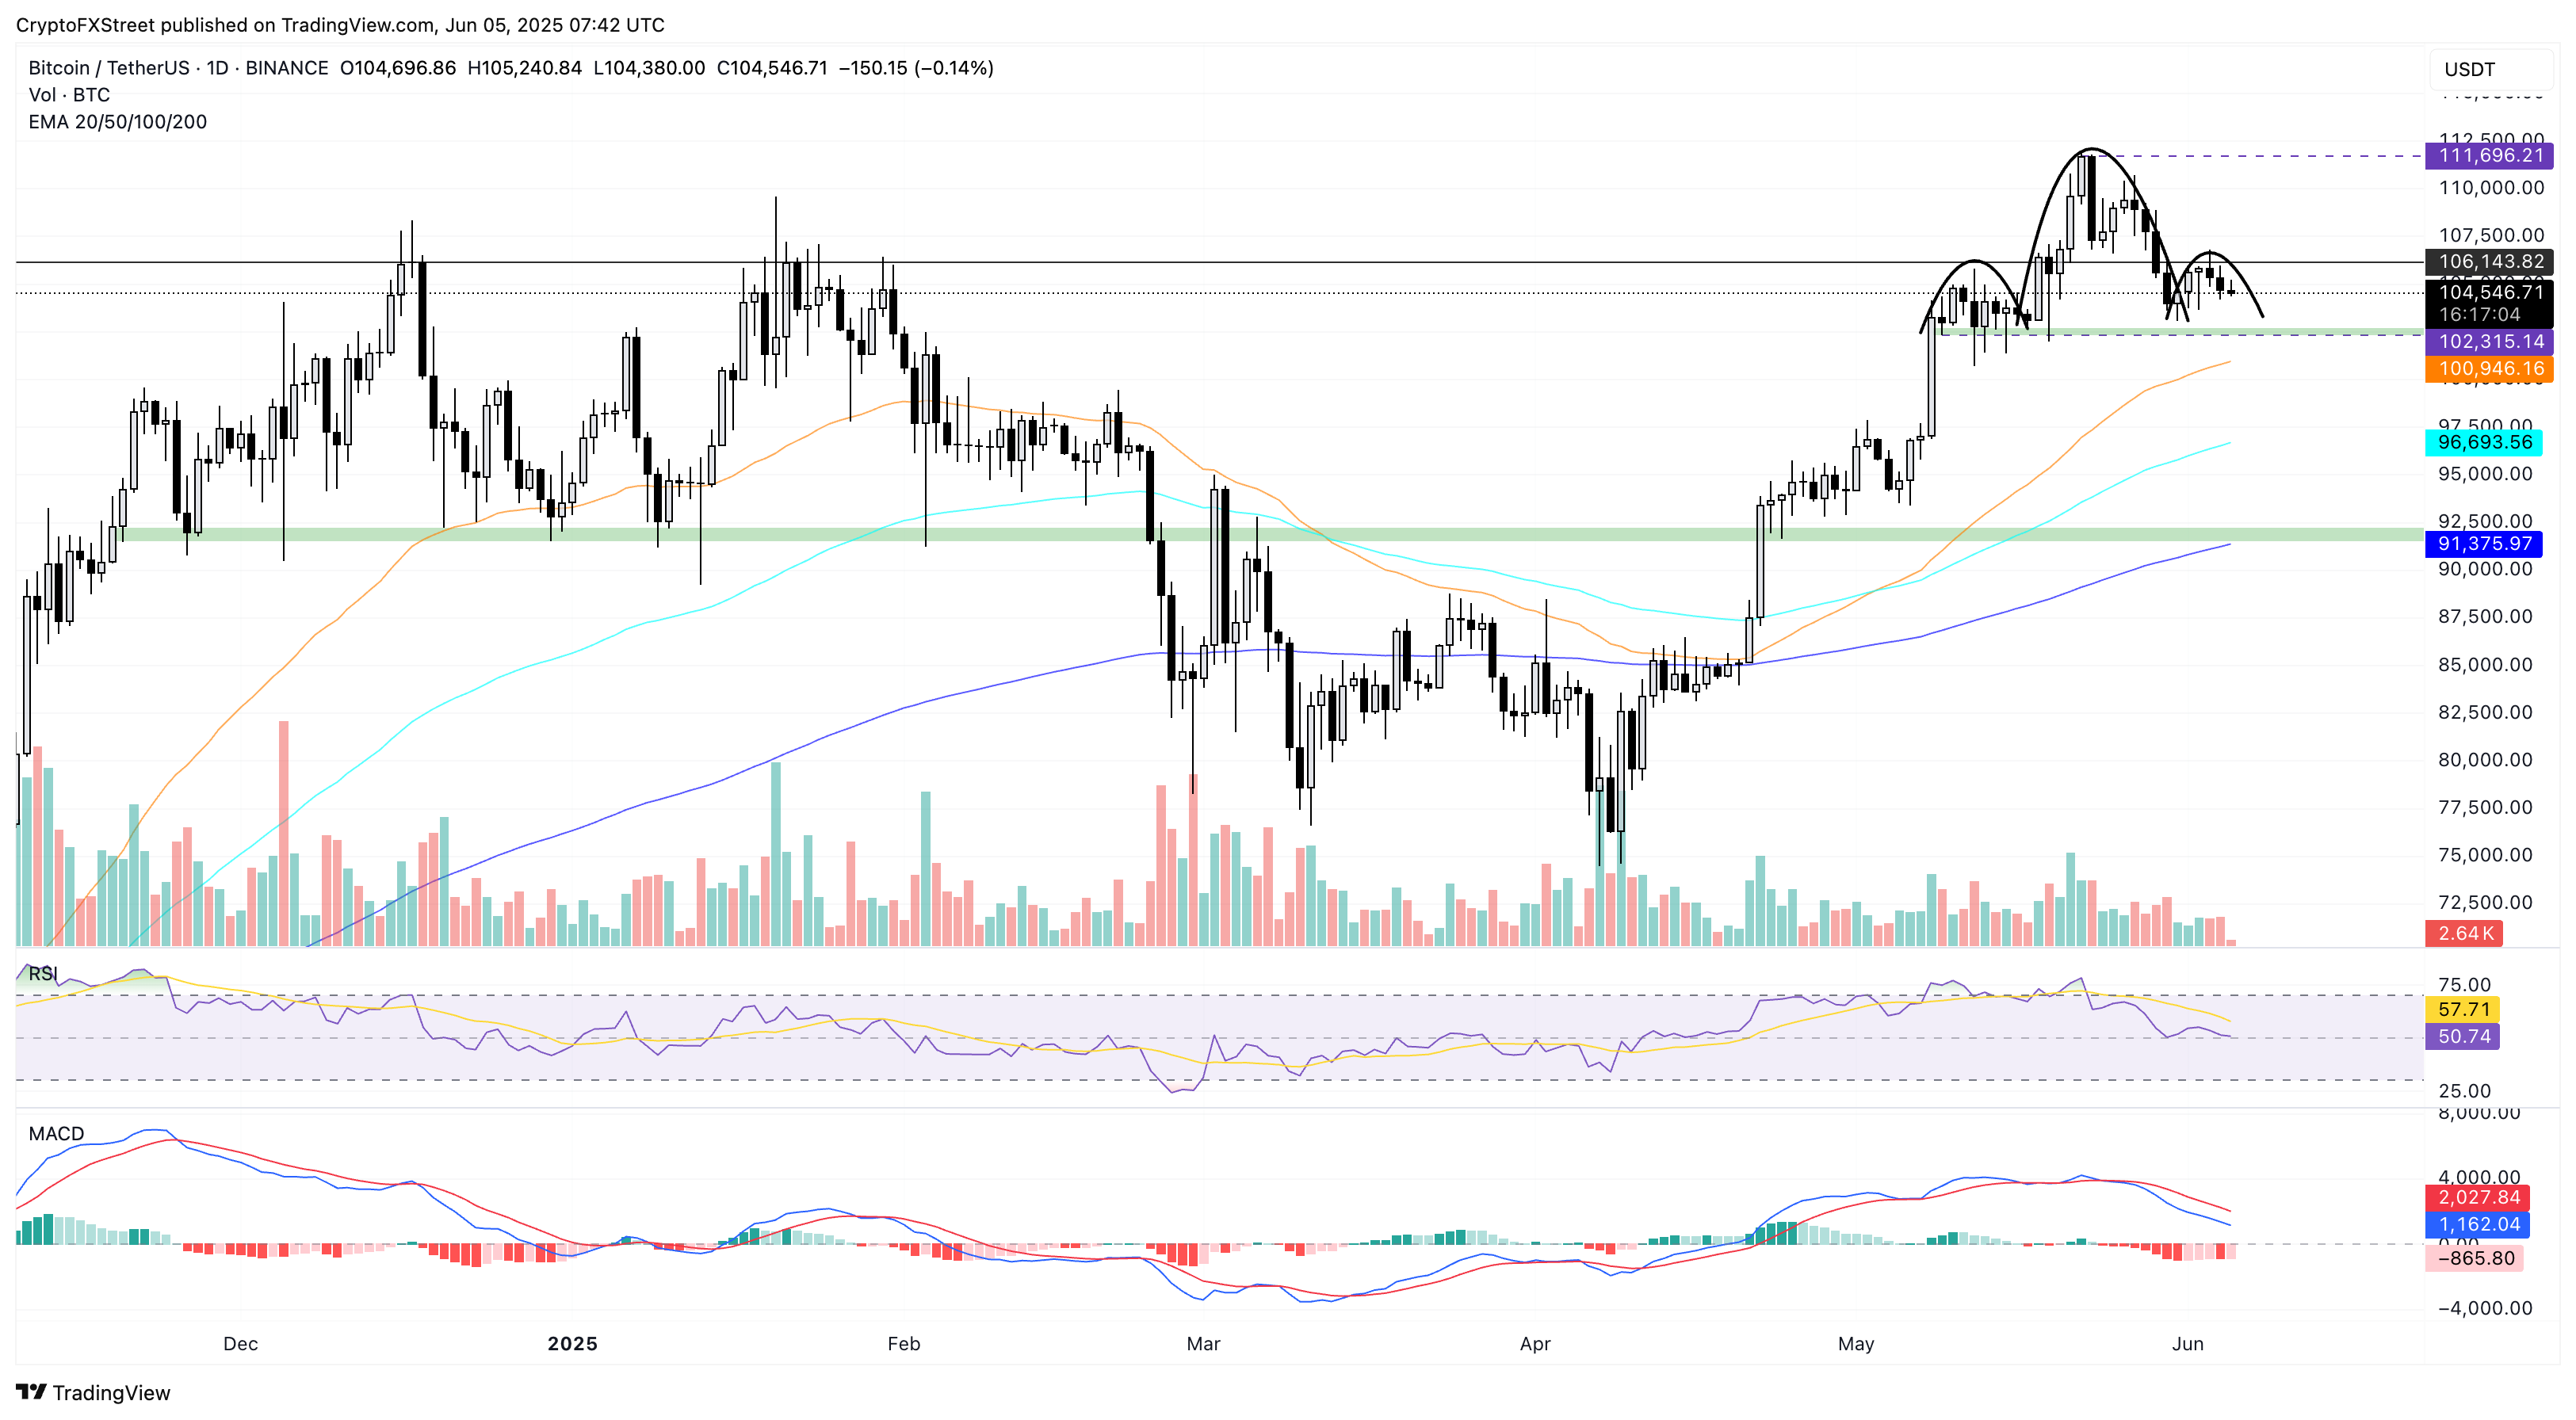
BTC/USDT daily chart. Source: Tradingview
However, a recovery in Bitcoin above the weekly high at $106,794 will nullify the bullish pattern. If so, the uptrend could target the current all-time high at $111,980.
Ethereum remains range-bound
Ethereum shows no significant price movement on Thursday after a long-wick Doji candle formed on Wednesday as it reversed from $2,679. This prolongs the consolidation in Ethereum as it holds the early May rally gains, above the 200-day EMA at $2,462.
However, the biggest altcoin has recorded five bullish failures to close above $2,700. With each bullish attempt, the daily RSI line creates a lower high, suggesting a fading in bullish momentum. This reflects an exaggerated bearish divergence in the Ethereum price trend, signaling a potential reversal.
On the contrary, the bullish crossover in the 50 and 100-day EMA lines supports a positive trend reversal thesis.
A clean push in closing price above $2,700 could test the 78.6% Fibonacci retracement level at $3,525, drawn between December’s high at $4,107 and April’s low at $1,385.
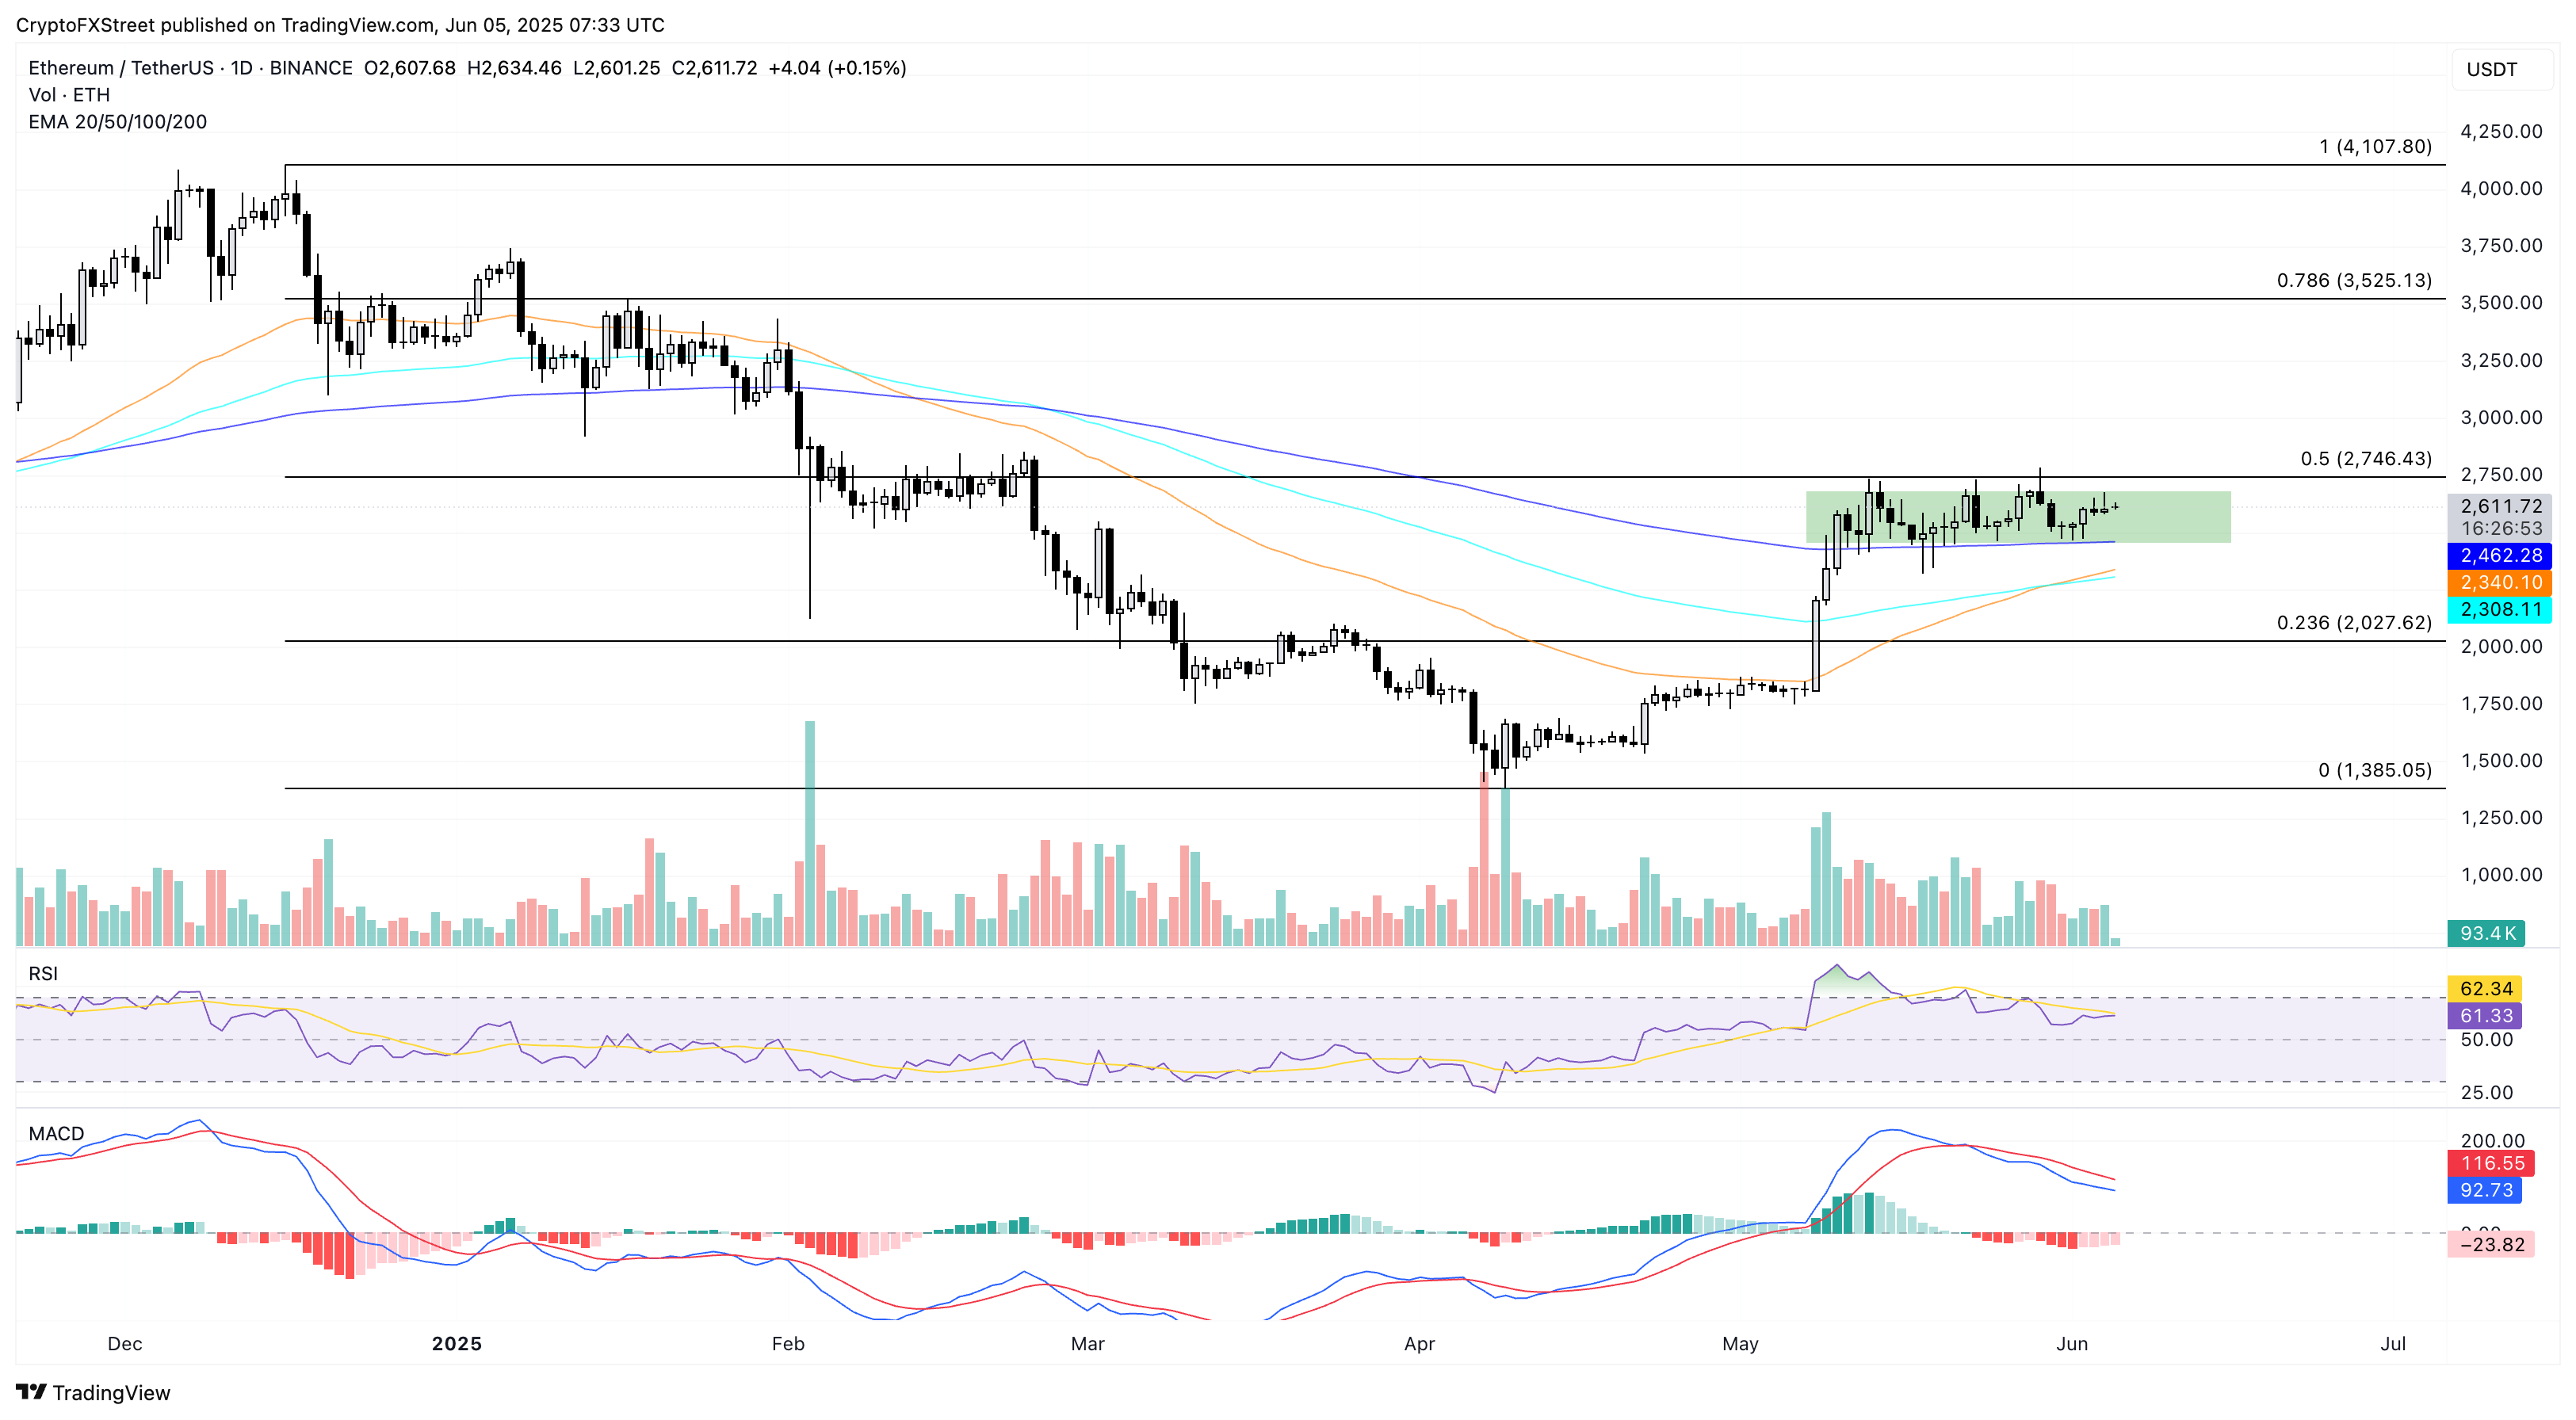
ETH/USDT daily chart. Source: Tradingview
Conversely, the crucial support remains the 200-day EMA at $2,462. A closing below the dynamic support could test the 50-day EMA at $2,340.
XRP risks losing the 200-day EMA support
XRP extends Wednesday’s 1.95% drop with a pullback of over 0.50% at press time on Thursday. As the altcoin drops under $2.20, traders anticipate the breakdown rally of a previously formed triangle pattern on the daily chart (formed by monthly highs of January, March, and May combined with lows of April and early May).
XRP is trapped between the 200-day EMA ($2.08) and the declining 50-day EMA ($2.27) and 100-day EMA ($2.26), struggling to regain bullish momentum. However, the MACD and signal lines fall into negative territory, while the RSI flips downside from the halfway line, indicating a bearish inclination.
A closing price below the 200-day EMA could extend the correction in XRP to $1.79, April’s lowest daily close.
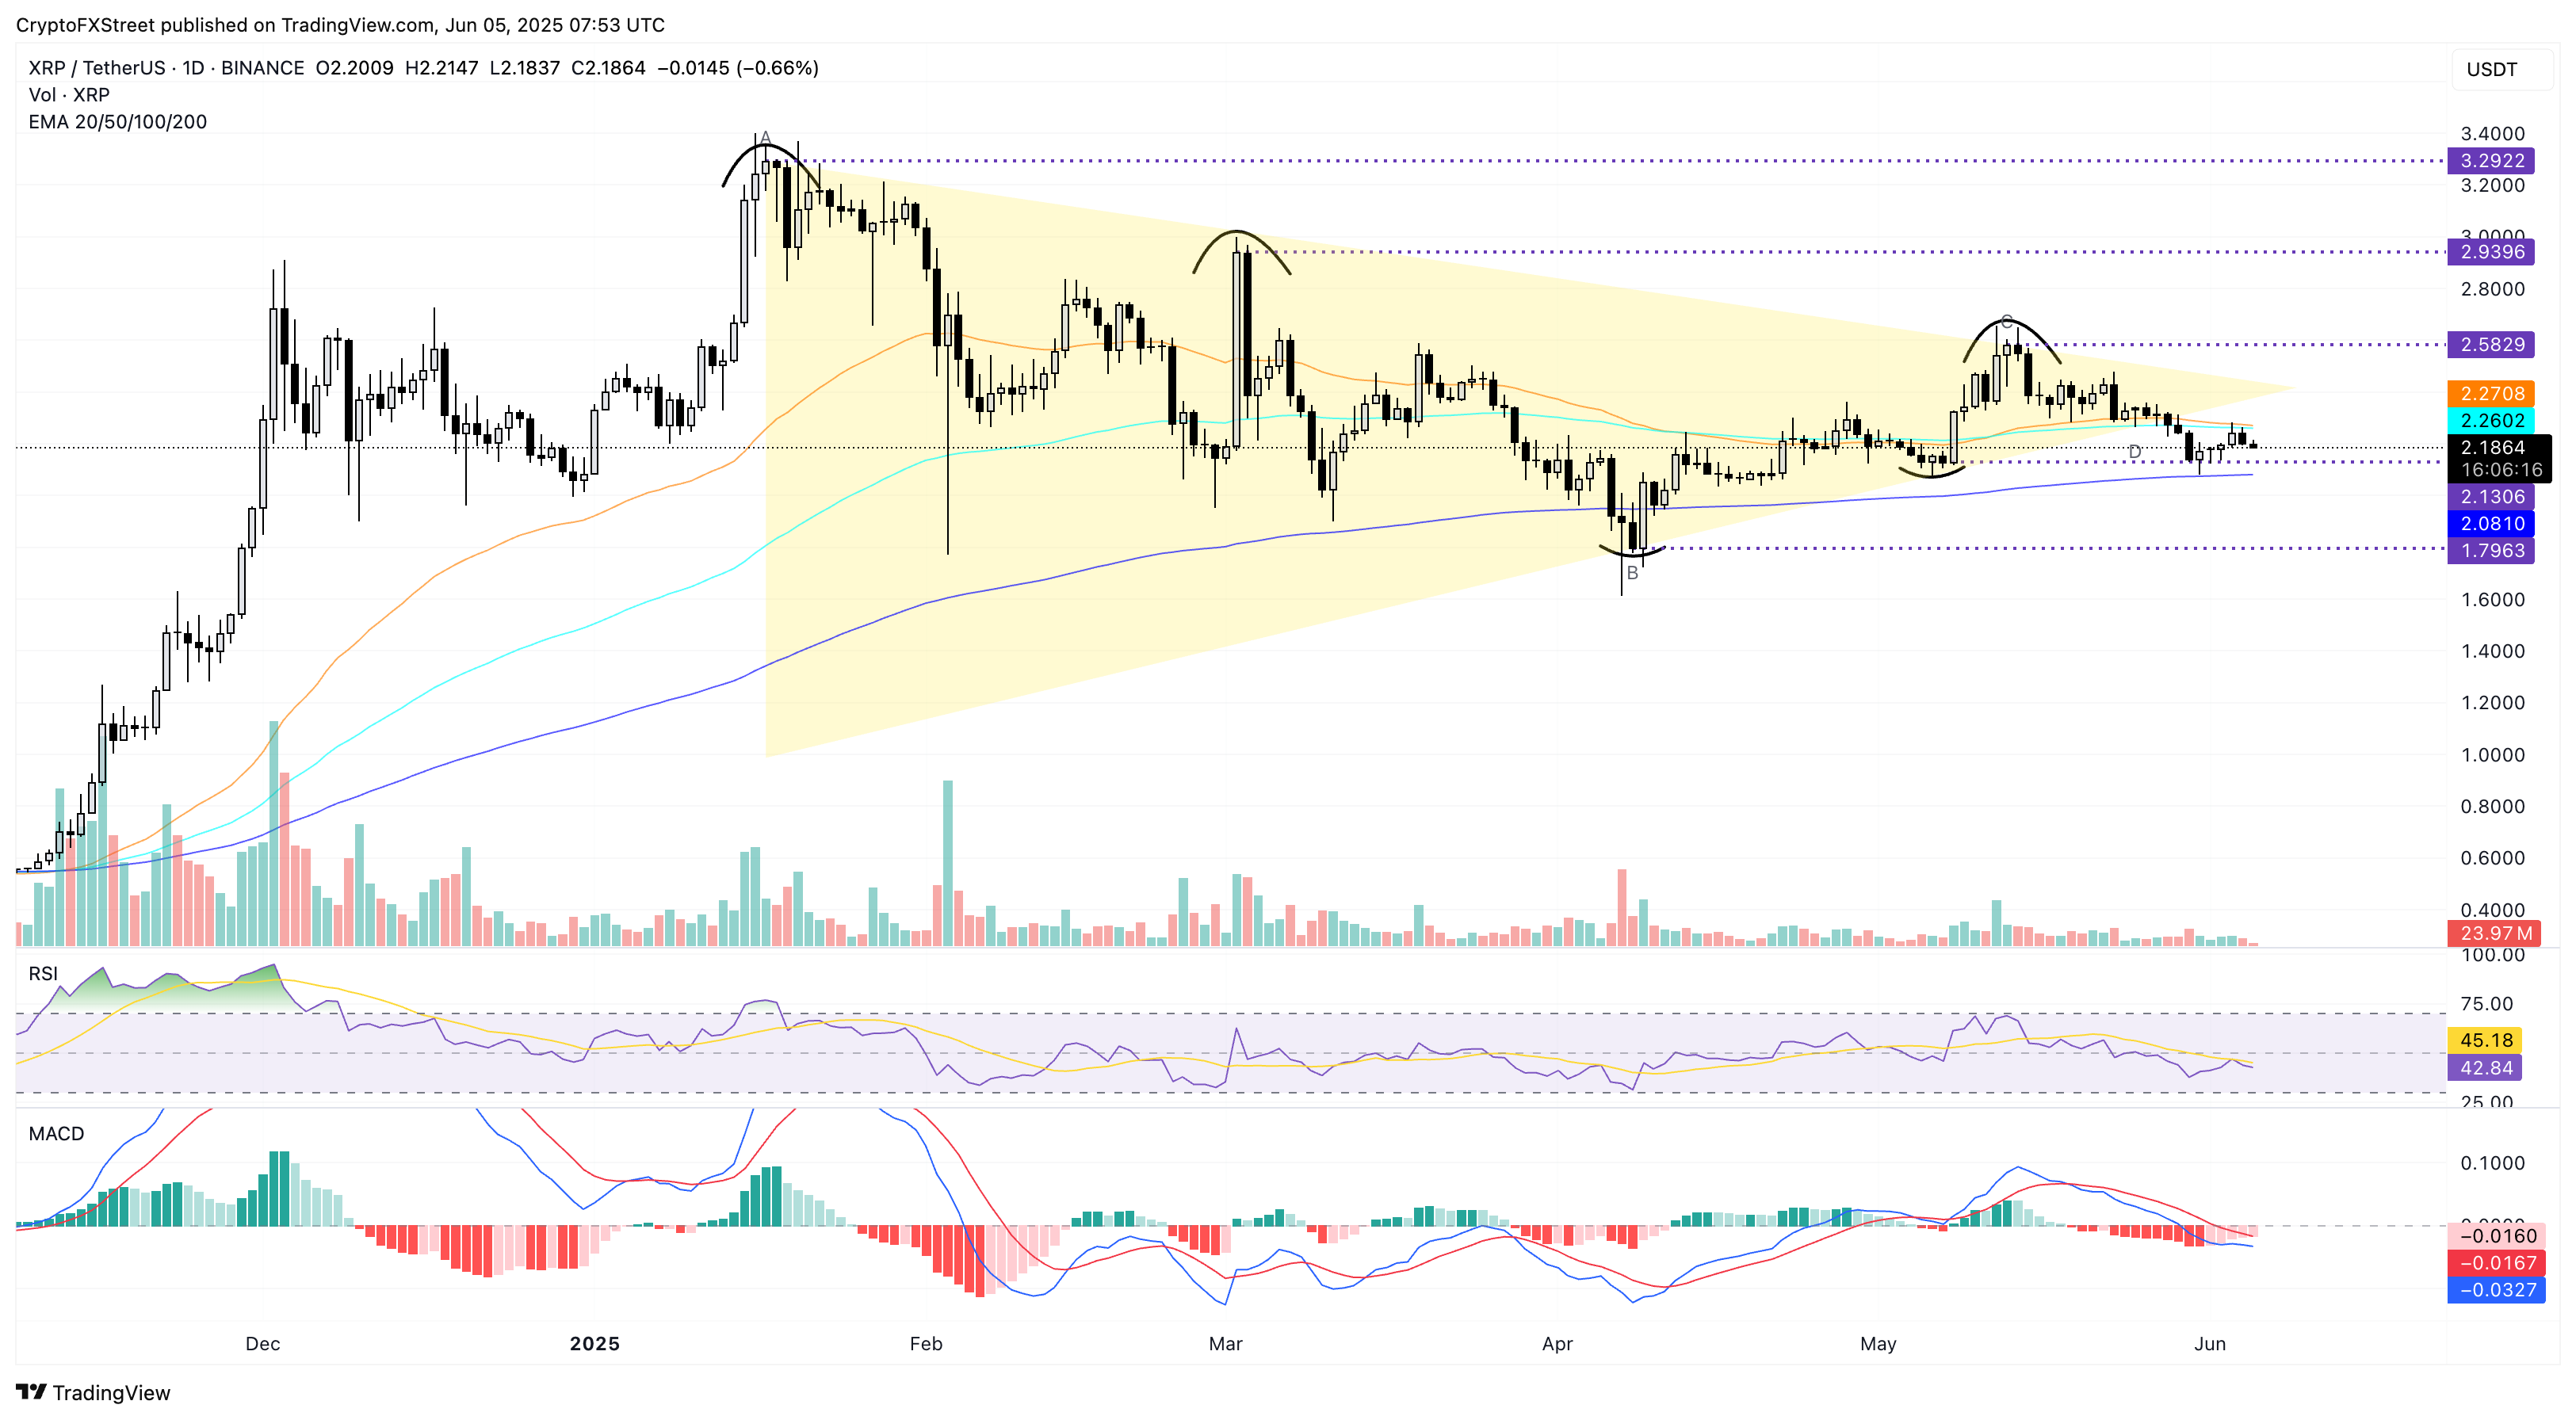
XRP/USDT daily chart. Source: Tradingview
If XRP survives the broader market volatility with a push above the 50-day EMA, it could test the $2.58 level, May's highest closing price.
Author

Vishal Dixit
FXStreet
Vishal Dixit holds a B.Sc. in Chemistry from Wilson College but found his true calling in the world of crypto.



