Top 3 Price Prediction Bitcoin, Ethereum, Ripple: BTC sideways trading indicates big move ahead
- Bitcoin has been trading relatively sideways this past weekend, holding above a key support level.
- Ethereum price has also defended a critical moving average and aims for a breakout soon.
- Ripple has outperformed the market as concerns over the SEC’s lawsuit have dissipated slightly.

The cryptocurrency market remained quite flat during the past weekend, but most indicators show top cryptos are on the verge of significant breakouts. Bitcoin is looking to take the lead again despite a drop in dominance toward 60%.
Bitcoin price faces no strong resistance ahead of all-time highs
Bitcoin is trading at $58,130 at the time of writing and is holding above the 26 EMA support level on the daily chart. This moving average is a crucial support point for the bulls.
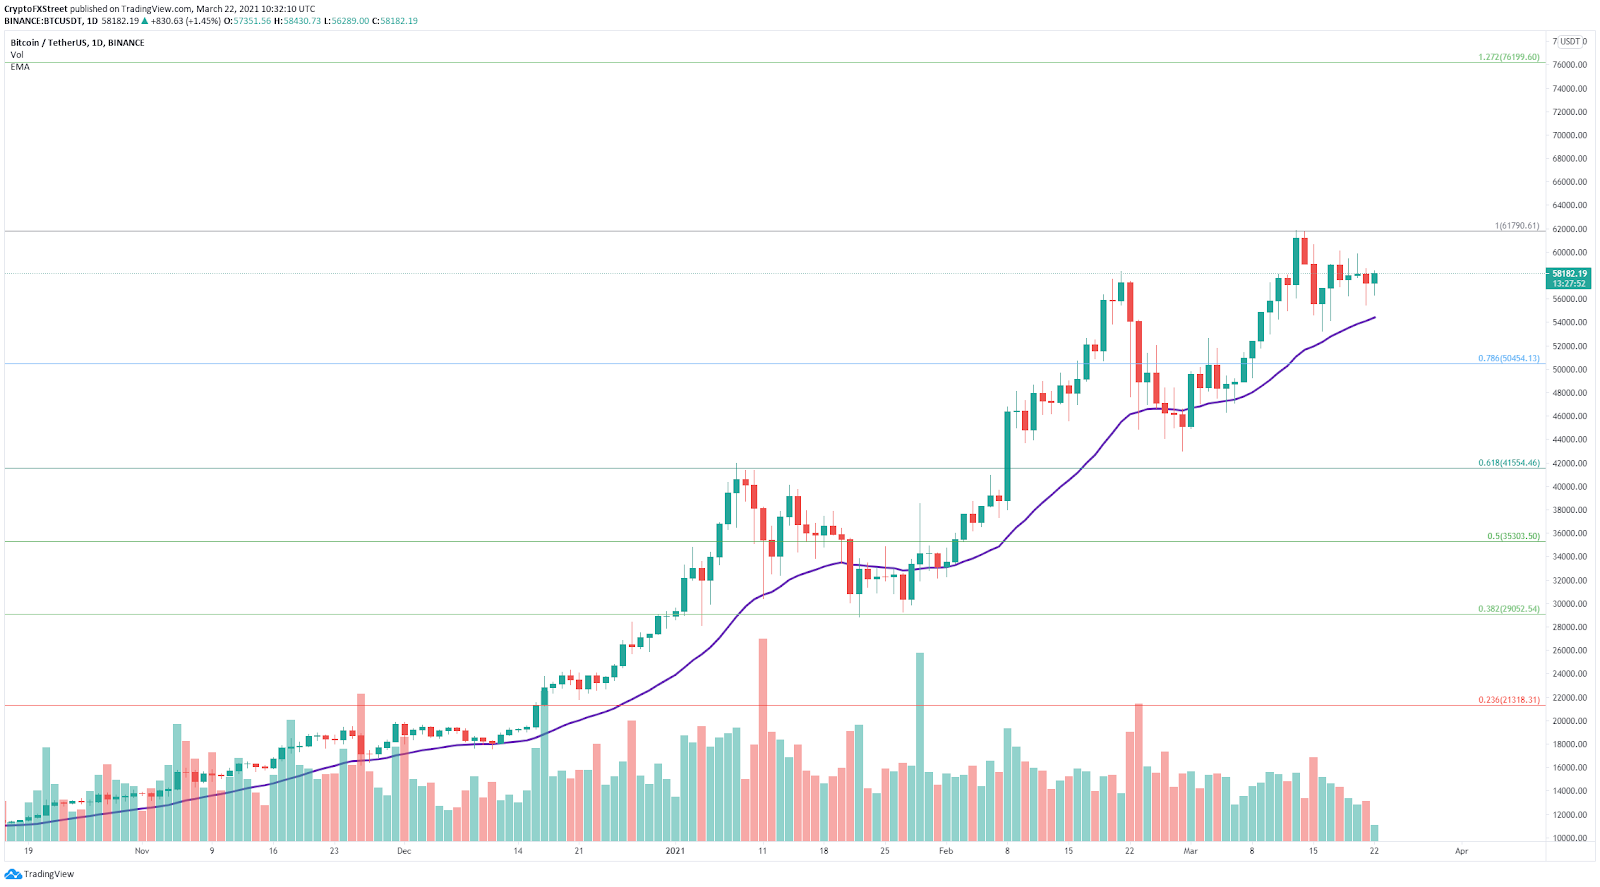
BTC/USD daily chart
A breakout above the previous all-time high of $61,844 should swiftly drive the Bitcoin price toward $76,199 at the 127.2% Fibonacci level. The In/Out of the Money Around Price (IOMAP) chart shows practically no resistance ahead.
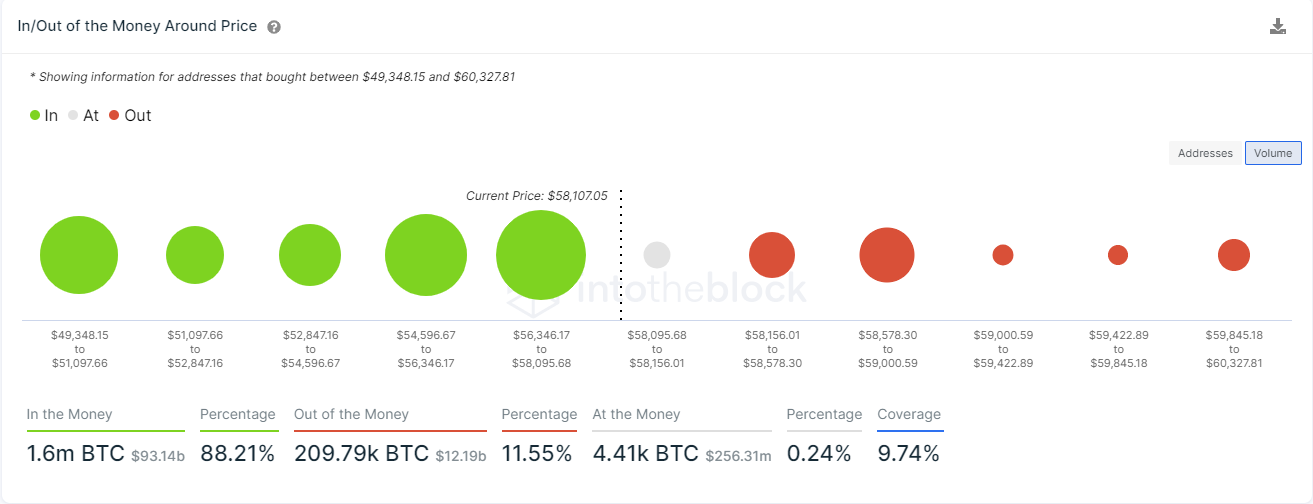
BTC IOMAP chart
The strongest barrier is located between $58,578 and $59,000, with a total volume of 124,000 BTC. On the other hand, losing the 26 EMA support level, currently located at $54,300, would push the Bitcoin price down to the psychological level of $50,000, which coincides with the 78.6% Fibonacci retracement level.
Ethereum price trades between two key levels
On the 4-hour chart, the Ethereum price has established a descending triangle pattern with its resistance trend line formed at $1,830 and support at $1,740.

ETH/USD 4-hour chart
For a breakout, Ethereum also has to conquer the 50 SMA resistance level at $1,808 and then beat $1,830, which should drive the Ethereum price up to $2,000 in the short term.
On the other hand, losing the 100 SMA at $1,780 would quickly push ETH down to the lower trend line at $1,740. A breakdown below this point has a price target of $1,567, which is a 10% move calculated using the height of the pattern as a reference point.
Ripple price sees another 7% breakout after SEC lawsuit concerns fade
The SEC sued Ripple for allegedly selling illegal securities in the form of XRP tokens. However, the SEC's lawyer, Jeremy Hogan, stated that although Ripple might have sold XRP illegally, investors did not, which means that exchanges should be safe to list XRP again.

XRP/USD 4-hour chart
Finally, XRP managed to climb above a critical resistance level at $0.495 with a price target of $0.57, which was almost hit as the digital asset trades at $0.55 at the time of writing. The next target is located at the psychological level of $0.60.
Author

Lorenzo Stroe
Independent Analyst
Lorenzo is an experienced Technical Analyst and Content Writer who has been working in the cryptocurrency industry since 2012. He also has a passion for trading.


