- Bitcoin price continues to struggle, but a sweep of $19,511 followed by a quick recovery could trigger a recovery rally to $20,692 and $21,874.
- Ethereum price follows Bitcoin’s footsteps and might drop to $1,471 to fill the imbalance.
- Ripple price shows an ascending triangle formation forecasting a 25% breakout from a long-term perspective.
Bitcoin price reveals a bearish start to the week, which would allow market makers to collect the much-anticipated sell-stop liquidity. This development is extremely important as it may set the base for an upcoming BTC and altcoin-wide recovery rally.
Bitcoin price hints at volatility
Bitcoin price has created equal lows at $19,511, which also coincides with the August low, making it an extremely important level to watch out for. A sweep of the aforementioned barrier could provide the buy signal for a recovery rally, which will be mainly driven by a reversion to the mean price after a 10% crash.
In such a case, investors can expect Bitcoin price to rally to $20,692, which is the midpoint of the $21,874 to $19,511 range. However, clearing this hurdle will lead to a sweep of the $21,874 level.
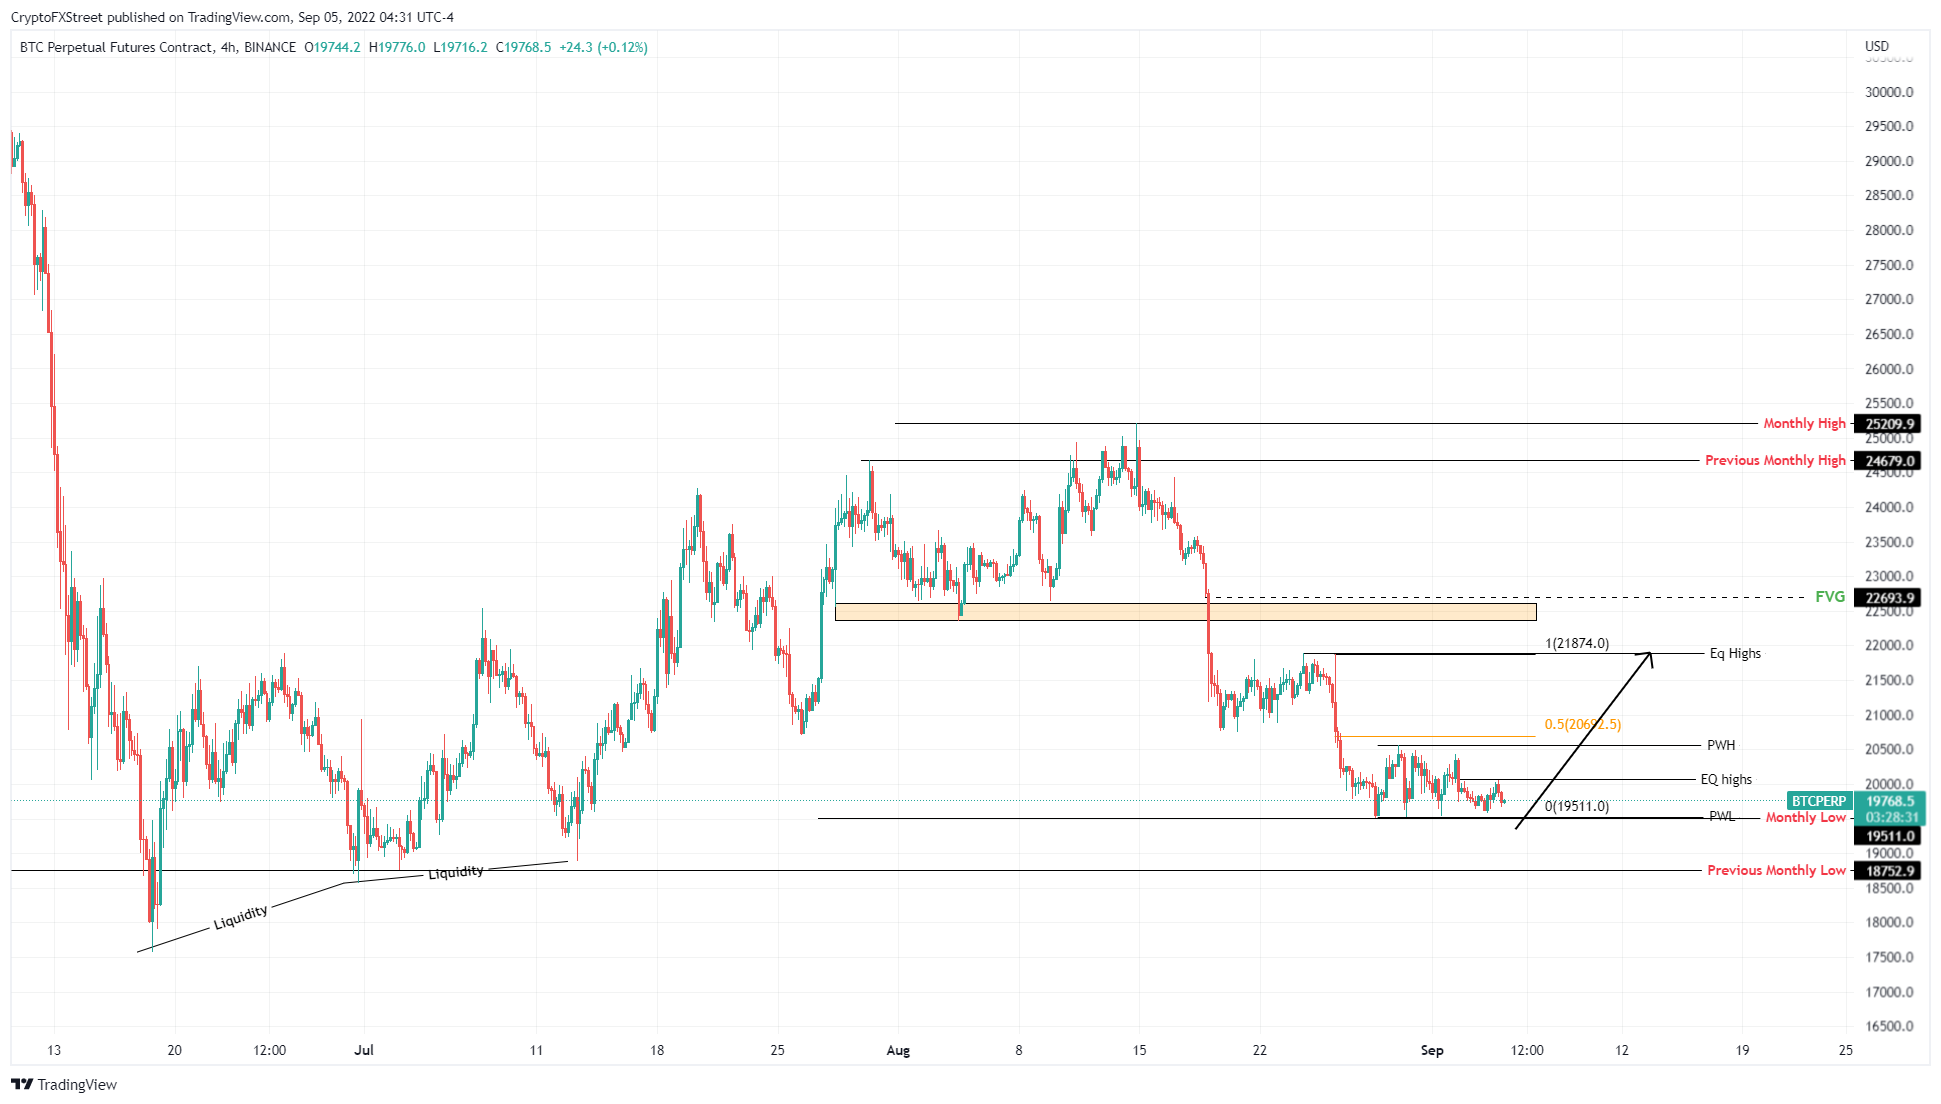
BTC/USD 4-hour chart
While things look promising for Bitcoin price, a daily candlestick close below $19,511 could result in the invalidation of the recovery rally. This development will also invalidate the bullish thesis and could further crash to $18,752.
Ethereum price shells out bearish signals
Ethereum price follows Bitcoin price and is attempting to break below the 50% Fibonacci retracement level at $1,563. If successful, it will confirm a bearish breakout and trigger a minor down move to $1,531.
Depending on the selling pressure, Ethereum price could visit $1,505 and fill the imbalance, extending from $1,471 to $1,454.
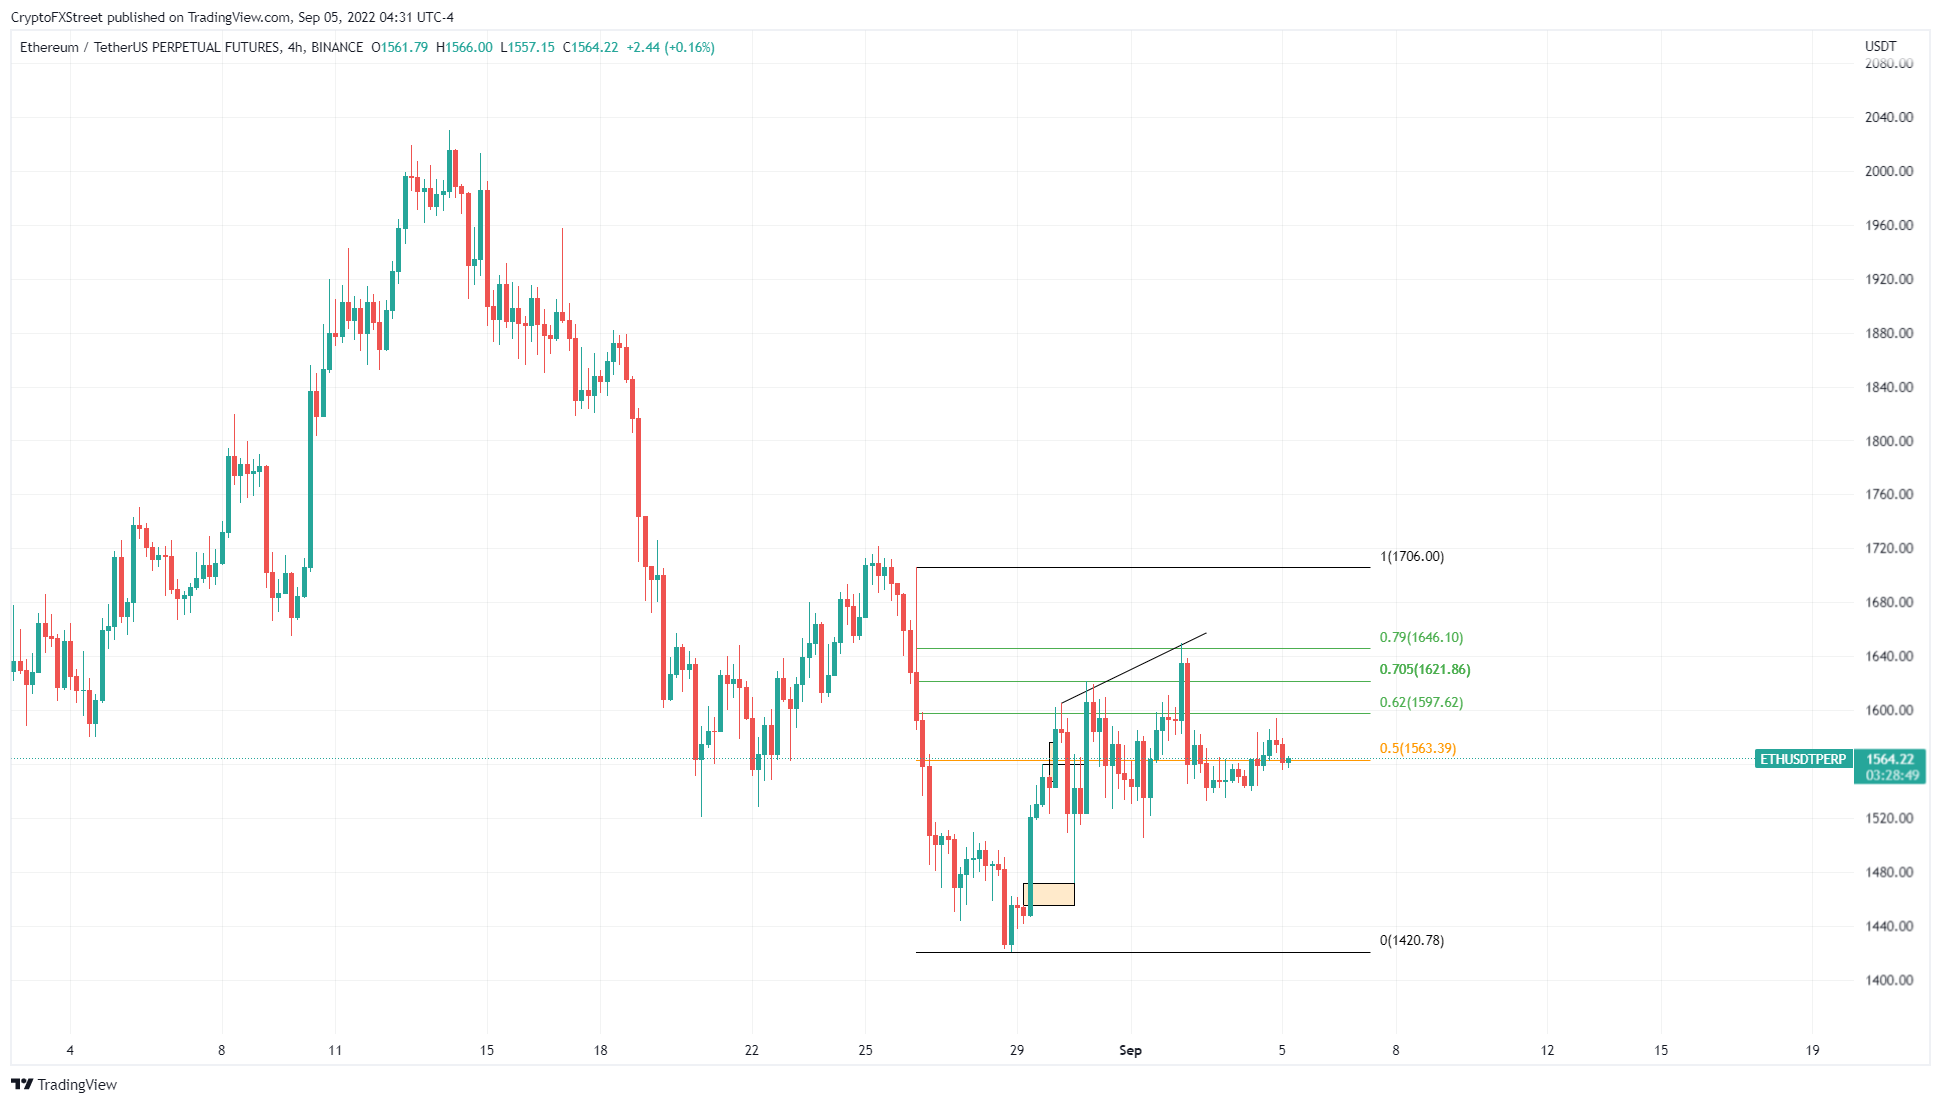
ETH/USD 4-hour chart
On the other hand, if Ethereum price flips range high at $1,706 into a support floor, it will invalidate the bearish thesis. This development could see ETH revisit $1,730 and, in some cases, $1,800.
Ripple price ready to make a big-time move
Ripple price has produced three distinctive higher lows and five equal highs at $0.381 since June 13. Connecting trend lines to these swing points reveals an ascending triangle. This technical formation forecasts a 25% upswing, determined by adding the distance between the first swing high at swing low to the breakout point at $0.381.
However, Ripple price and its journey north will face a hurdle at $0.439, clearing this level will put the $0.477 target in reach.
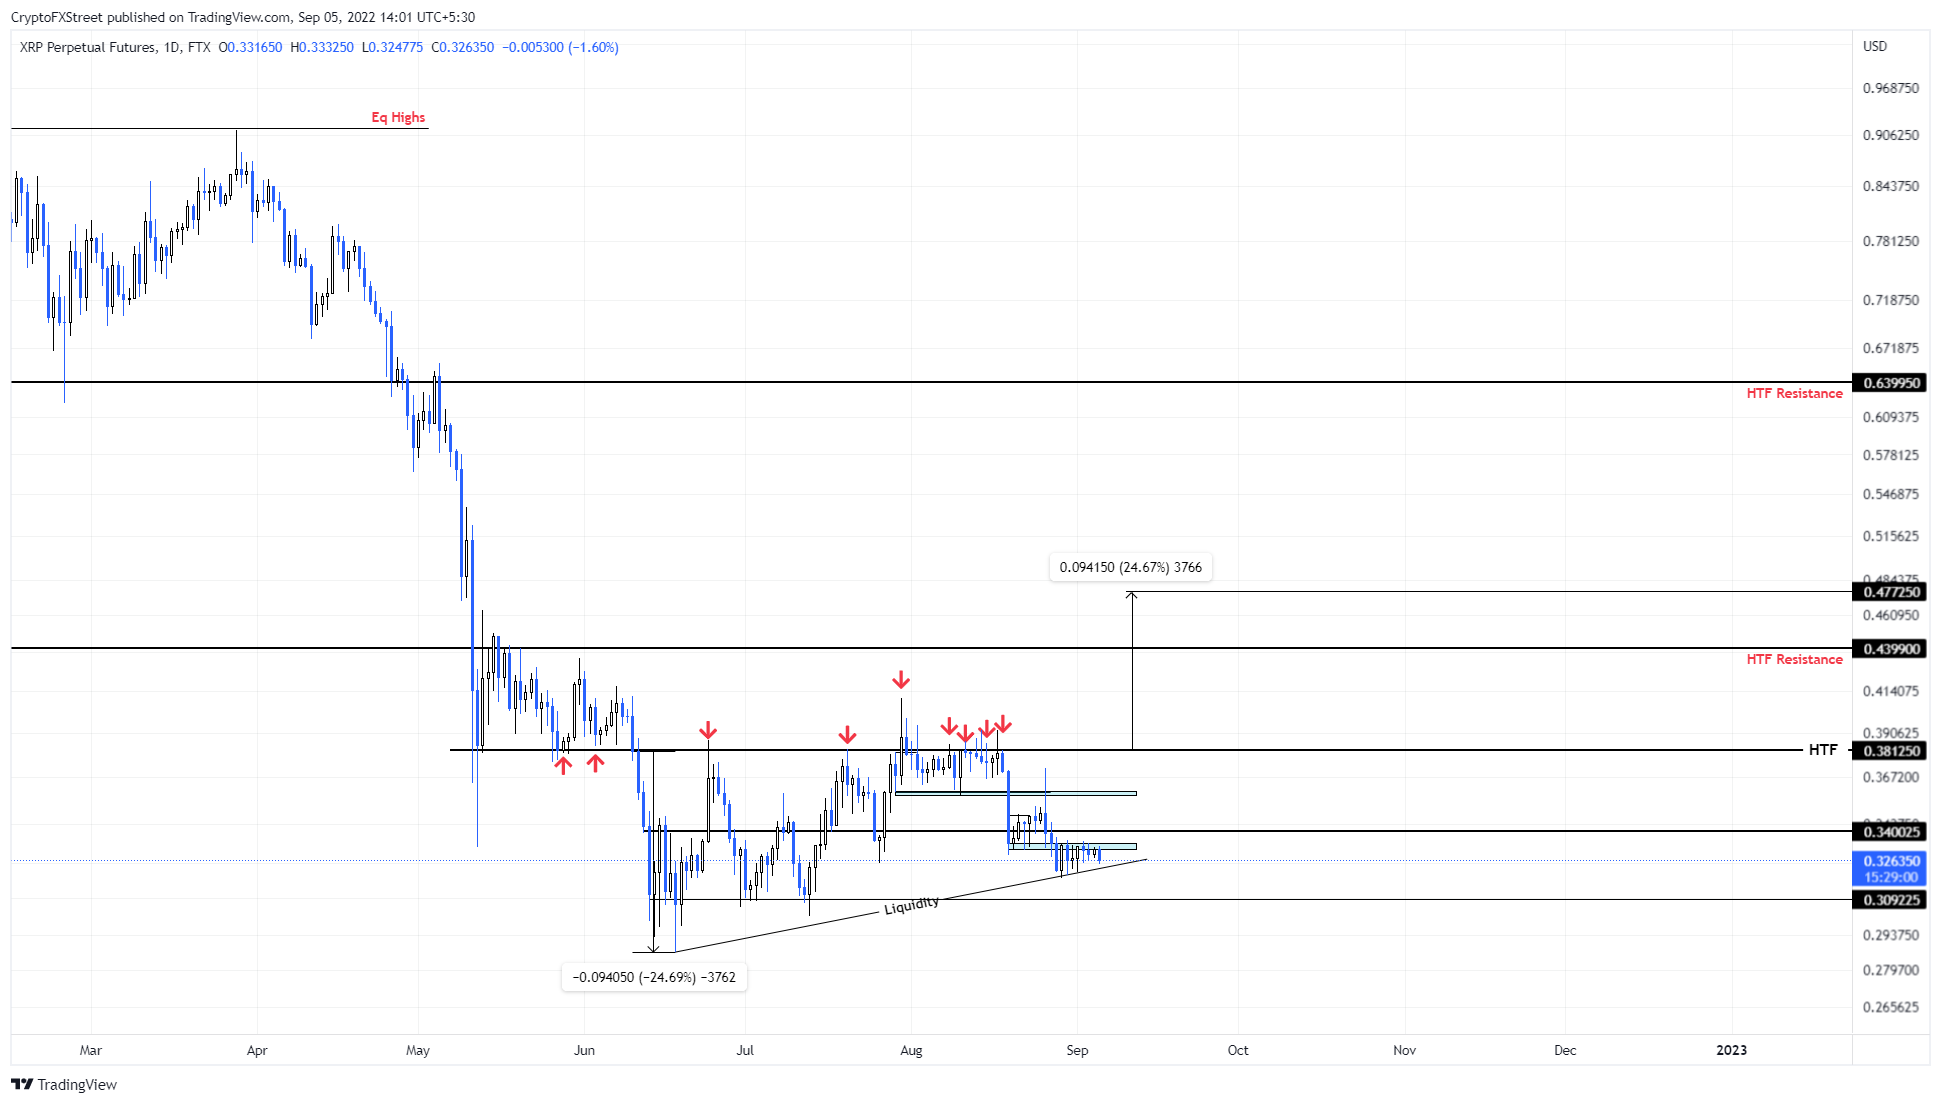
XRP/USD 1-day chart
Regardless of the bullish outlook, investors should prepare for a sweep of August 29 lows at $0.318. However, a flip of this level, creating a lower low without a recovery will invalidate the bullish thesis for Ripple price.
Information on these pages contains forward-looking statements that involve risks and uncertainties. Markets and instruments profiled on this page are for informational purposes only and should not in any way come across as a recommendation to buy or sell in these assets. You should do your own thorough research before making any investment decisions. FXStreet does not in any way guarantee that this information is free from mistakes, errors, or material misstatements. It also does not guarantee that this information is of a timely nature. Investing in Open Markets involves a great deal of risk, including the loss of all or a portion of your investment, as well as emotional distress. All risks, losses and costs associated with investing, including total loss of principal, are your responsibility. The views and opinions expressed in this article are those of the authors and do not necessarily reflect the official policy or position of FXStreet nor its advertisers. The author will not be held responsible for information that is found at the end of links posted on this page.
If not otherwise explicitly mentioned in the body of the article, at the time of writing, the author has no position in any stock mentioned in this article and no business relationship with any company mentioned. The author has not received compensation for writing this article, other than from FXStreet.
FXStreet and the author do not provide personalized recommendations. The author makes no representations as to the accuracy, completeness, or suitability of this information. FXStreet and the author will not be liable for any errors, omissions or any losses, injuries or damages arising from this information and its display or use. Errors and omissions excepted.
The author and FXStreet are not registered investment advisors and nothing in this article is intended to be investment advice.
Recommended Content
Editors’ Picks
Polkadot Price Forecast: DOT confirms trend reversal, eyes retest of $5 after reclaiming key hurdle

Polkadot seems to be ending its downtrend after shedding 92.91% in the last two years from its all-time high of $55.09. In the last three days, DOT has inflated by 3.3%, breaching a declining trendline and confirming the potential start of an uptrend.
Floki Inu Price Forecast: FLOKI sets stage for 30% rally

Floki Inu price rallied nearly 20% on September 30 but closed the candlestick with a 12% gain. The recent uptick opens the possibility of a 30% rally for FLOKI holders. A daily candlestick close below the $0.0000160 level would invalidate the bullish thesis.
Binance Coin Price Prediction: BNB struggles will end after reclaiming $228

Binance Coin (BNB) price has been in a tight consolidation for nearly six weeks. But the range tightening could end soon, potentially allowing bulls to take over and attempt to flip multiple hurdles standing in their way.
Solana Price Forecast: SOL big picture to flip bullish soon, all eyes on $26

Solana (SOL) price seems to be undoing the bearish pressure that has kept it subdued all this time. The recent spike in buying pressure has pushed SOL to produce a higher high on the three-day chart, signaling a shift in momentum favoring bulls.
Bitcoin: BTC recovery rally could be bull trap in disguise, here’s why

Bitcoin (BTC) price remains unfazed even after the multiple spot BTC ETF delays from the US Securities & Exchange Commission (SEC). But investors need to be careful with the ongoing BTC rally as it could be a trap for early bulls.