Top 3 Price Prediction Bitcoin, Ethereum, Ripple: BTC, ETH and XRP poised for corrections
- Bitcoin price hovers around the $103,300 level on Friday after rising almost 2% this week.
- Ethereum price finds support around its 200-day EMA at $3,133; a firm close below would lead to a correction.
- Ripple price edges slightly down on Friday after rallying 4% this week.

Bitcoin (BTC) hovers around the $103,300 level on Friday after rising almost 2% this week. Ethereum (ETH) finds support around its key level; a firm close below this would lead to a correction, while Ripple (XRP) price edges slightly down on Friday after rallying 4% this week.
Bitcoin price is primed for a correction if it closes below $100K support
Bitcoin price reached a new all-time high (ATH) of $109,588 at the start of this week on Monday but quickly slipped 6.68% and closed at $102,260. However, the next day, it found support around its key $100,000 level and rose 3.8%. On Wednesday, it could not sustain its rise and fell 2.3%, closing below $104,000. At the time of writing on Friday, it continues to edge down around $103,255.
If BTC continues to edge down and closes below $100,000, it could extend the decline to retest its next support level at $90,000.
The Relative Strength Index (RSI) indicator on the daily chart reads 57, above its neutral level of 50; however, it points downwards, indicating a slowdown in bullish momentum. The Moving Average Convergence Divergence (MACD) indicator is also converging. If the MACD flips to a bearish crossover on a daily basis, it would give sell signals and suggest a downtrend.
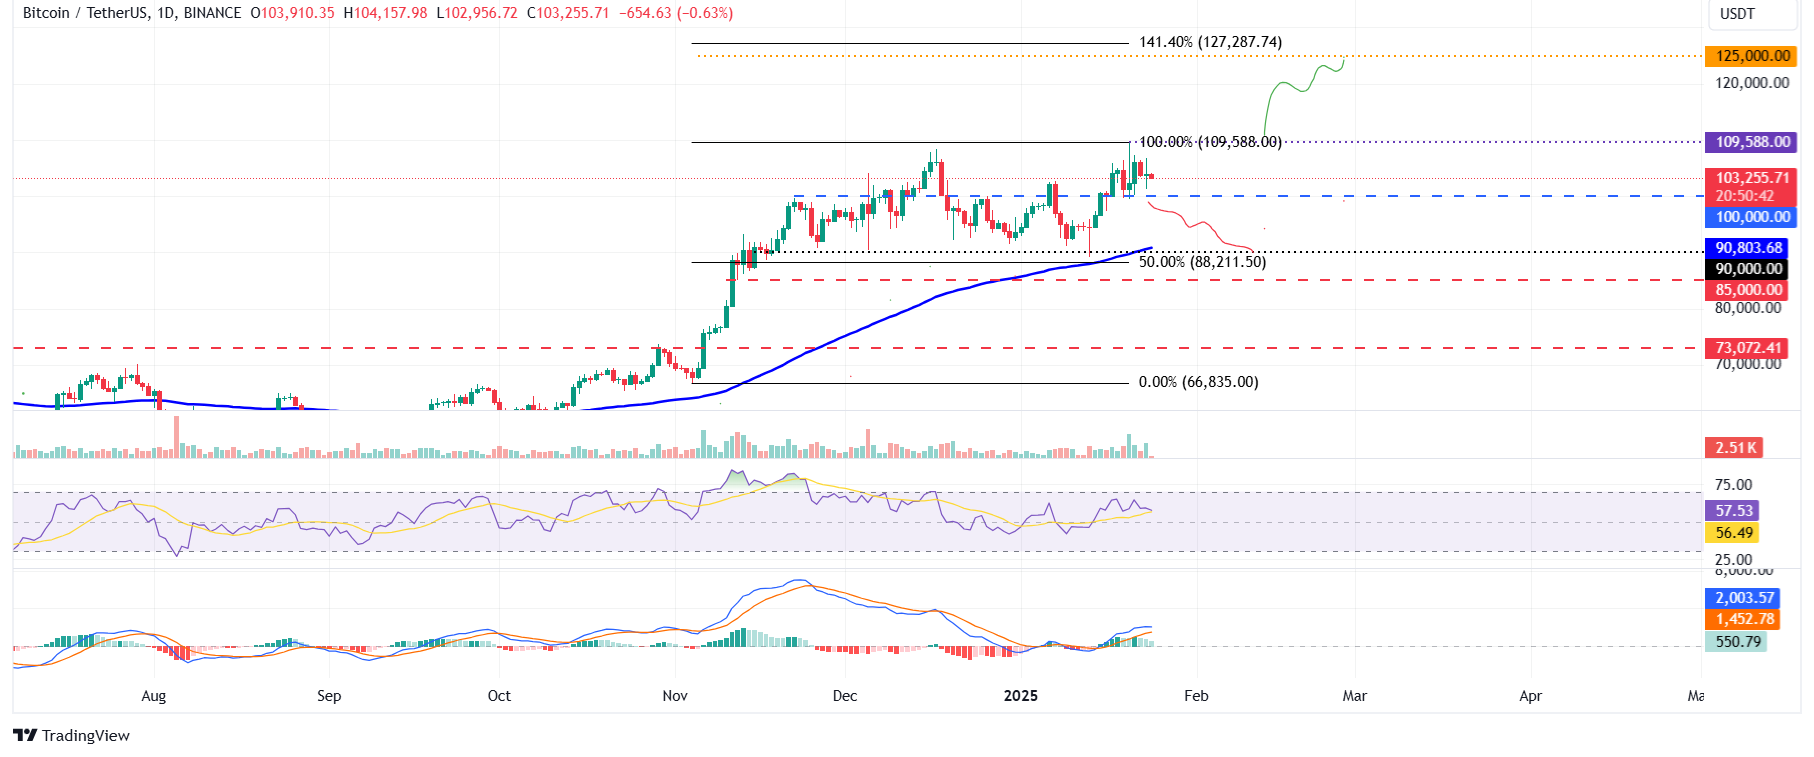
BTC/USDT daily chart
However, if the $100K support level holds and BTC breaks above its all-time-high, it could extend the rally above the $125K mark, calculated by the 141.40% Fibonacci extension level (drawn from the November 4 low of $66,835 to Monday’s ATH of $109,588) at $127,287.
Ethereum price is positioned for a pullback if it closes below 200-day EMA
Ethereum bulls were retested, and support was found around its 200-day Exponential Moving Average (EMA) at $3,133 on Sunday, and it recovered 3.83% in the next four days. At the time of writing on Friday, it hovers around $3,310.
If ETH closes below the 200-day EMA at $3,133, it could extend the decline to test its psychological importance level of $3,000.
The RSI indicator on the daily chart reads 47, below its neutral level of 50, pointing downwards, indicating weakness in bullish momentum. The MACD indicator also converged, indicating indecisiveness among the traders.
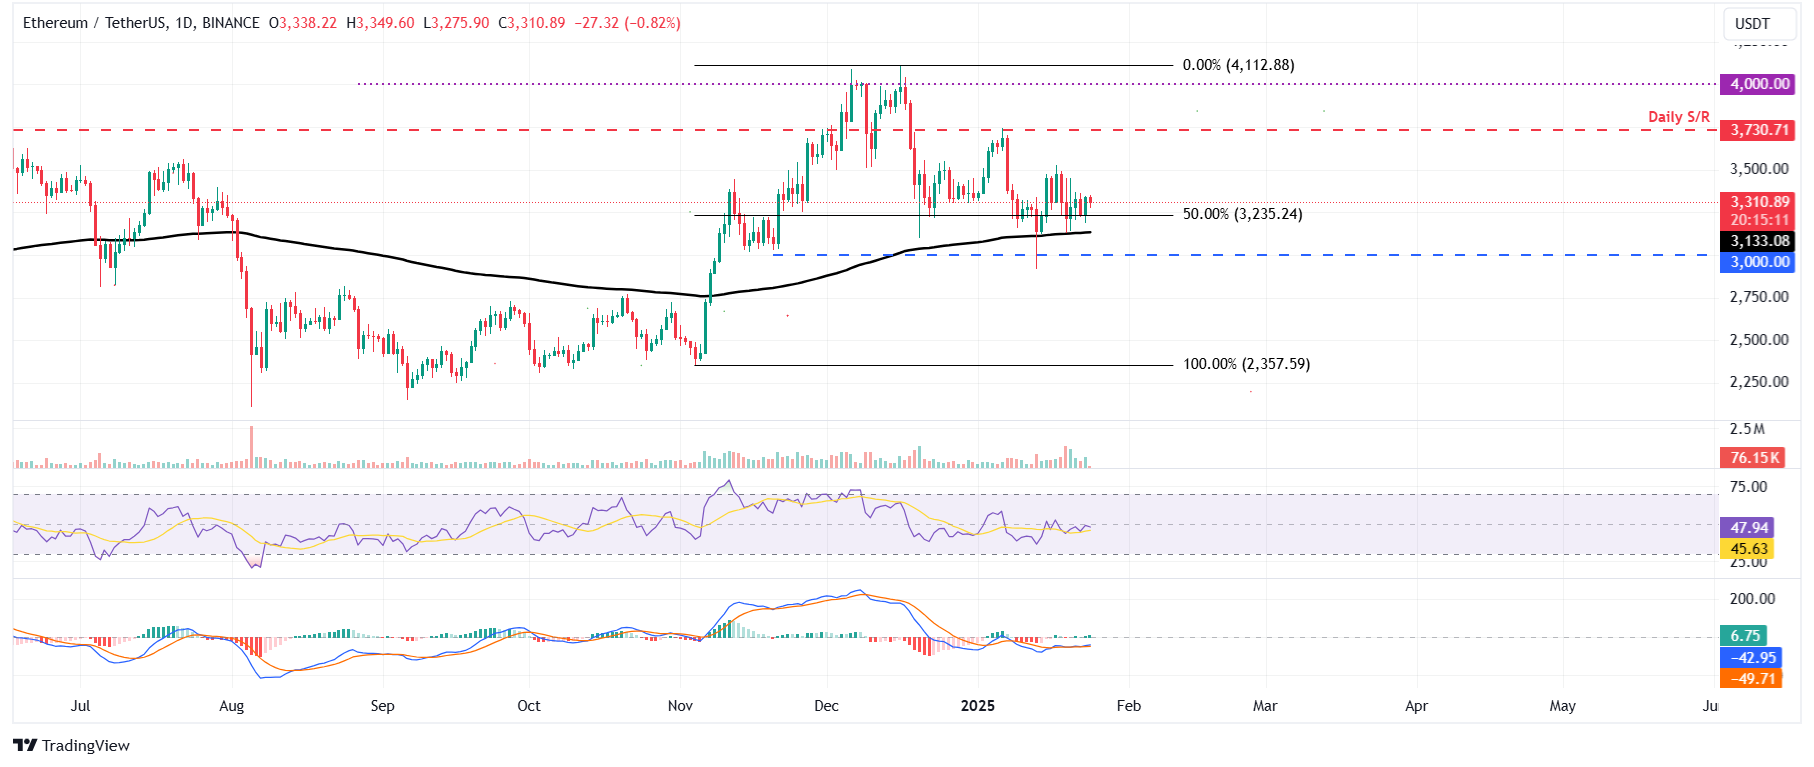
ETH/USDT daily chart
On the other hand, if the $3,130 EMA level is maintained, ETH could extend the recovery to test its daily resistance level at $3,730.
Ripple bulls show signs of exhaustion
Ripple price retested its upper symmetrical triangle boundary at the start of the previous week and rallied 30.48% until Friday. However, it faced rejection around the $3.30 level on Saturday and declined 10.14% until Sunday. XRP recovered by 7.49% until the next three days. At the time of writing on Friday, it hovers around $3.12.
If XRP continues its upward momentum, it could extend the rally to test its technical target obtained by this pattern, which would be $3.63.
The RSI indicator reads 63, above its neutral value of 50 and points downwards after rejection from its overbought level of 70 on Saturday, indicating weakness in bullish momentum. Additionally, the MACD is about to flip a bearish crossover. If the MACD flips to a bearish crossover on a daily basis, it would give sell signals and suggest a downtrend.
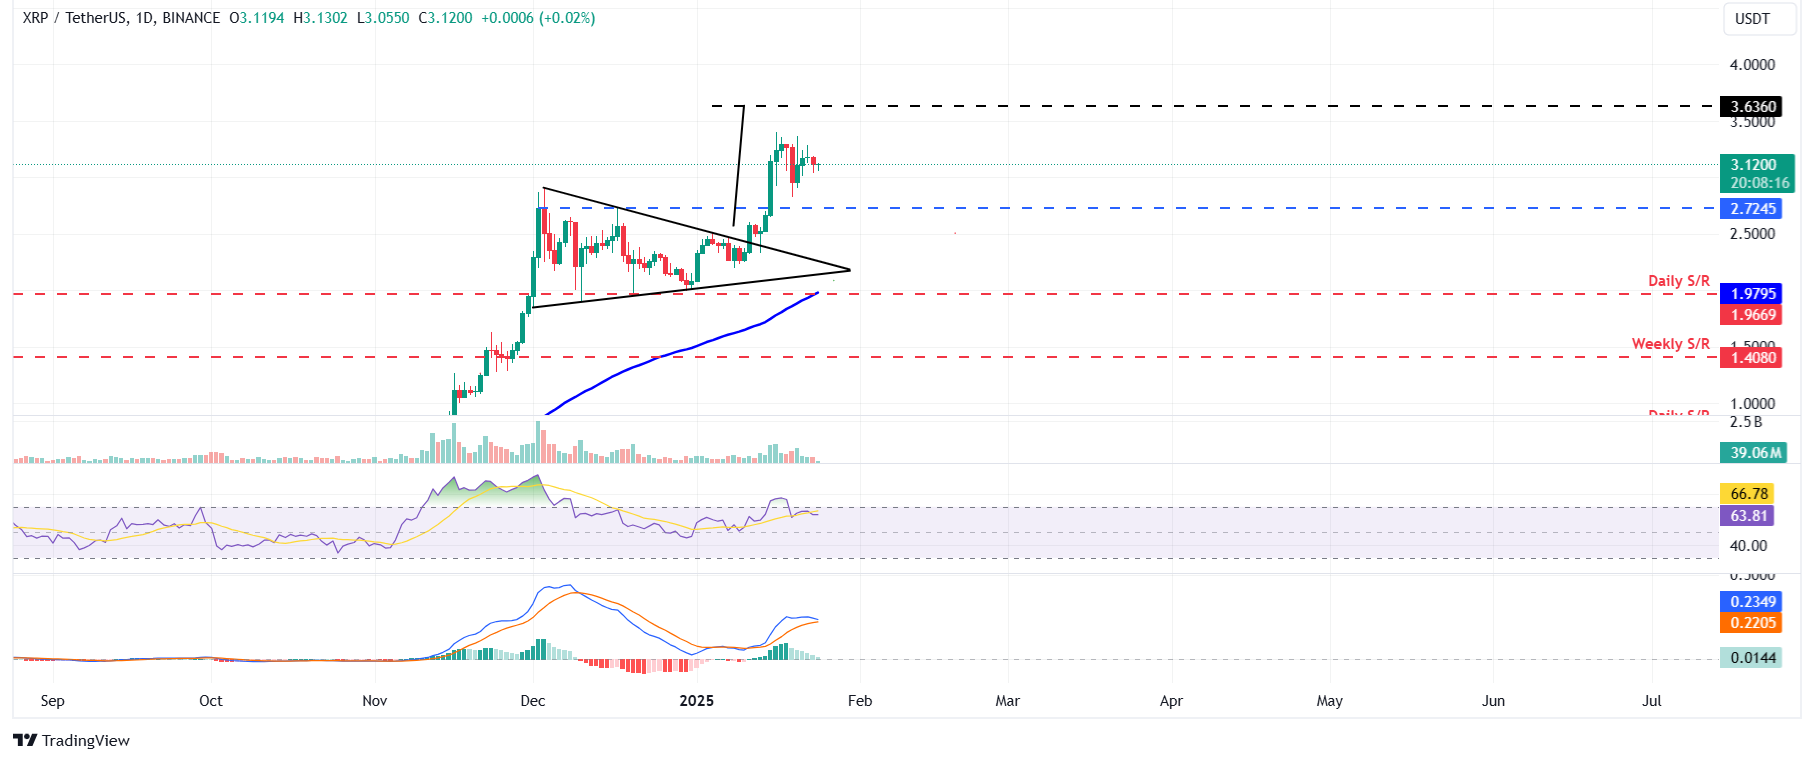
XRP/USDT daily chart
Conversely, if XRP closes below the $1.96 daily support level, it would extend the decline to retest its next support level at $1.40.
Bitcoin, altcoins, stablecoins FAQs
Bitcoin is the largest cryptocurrency by market capitalization, a virtual currency designed to serve as money. This form of payment cannot be controlled by any one person, group, or entity, which eliminates the need for third-party participation during financial transactions.
Altcoins are any cryptocurrency apart from Bitcoin, but some also regard Ethereum as a non-altcoin because it is from these two cryptocurrencies that forking happens. If this is true, then Litecoin is the first altcoin, forked from the Bitcoin protocol and, therefore, an “improved” version of it.
Stablecoins are cryptocurrencies designed to have a stable price, with their value backed by a reserve of the asset it represents. To achieve this, the value of any one stablecoin is pegged to a commodity or financial instrument, such as the US Dollar (USD), with its supply regulated by an algorithm or demand. The main goal of stablecoins is to provide an on/off-ramp for investors willing to trade and invest in cryptocurrencies. Stablecoins also allow investors to store value since cryptocurrencies, in general, are subject to volatility.
Bitcoin dominance is the ratio of Bitcoin's market capitalization to the total market capitalization of all cryptocurrencies combined. It provides a clear picture of Bitcoin’s interest among investors. A high BTC dominance typically happens before and during a bull run, in which investors resort to investing in relatively stable and high market capitalization cryptocurrency like Bitcoin. A drop in BTC dominance usually means that investors are moving their capital and/or profits to altcoins in a quest for higher returns, which usually triggers an explosion of altcoin rallies.
Author

Manish Chhetri
FXStreet
Manish Chhetri is a crypto specialist with over four years of experience in the cryptocurrency industry.


