Top 3 Price Prediction: Bitcoin, Ethereum, Ripple – BTC, ETH and XRP dips as bearish pressure lingers
- Bitcoin price hovers near its 50-day EMA support, with a firm close below likely to open the door to deeper losses.
- Ethereum price extends its correction after slipping below the critical $4,488 support level.
- XRP price continues to decline, adding to last week’s nearly 2% drop as bearish pressure lingers.

Bitcoin (BTC), Ethereum (ETH), and Ripple (XRP) faced renewed selling pressure on Monday, following corrections of 0.3%, 3.5%, and 2%, respectively, in the previous week. Weakening momentum across these top three cryptocurrencies signals the risk of further downside.
Bitcoin could extend losses if it closes below key support
Bitcoin price broke below its daily support level at $116,000 on Friday and declined slightly over the weekend. At the time of writing on Monday, it continues its correction, nearing its key support at the 50-day Exponential Moving Average (EMA) at $114,002.
If BTC closes below the 50-day EMA at $114,002 on a daily basis, it could extend the decline toward its next daily support at $107,245.
The Relative Strength Index (RSI) on the daily chart is slipping below its neutral level of 50, indicating early bearish momentum. The Moving Average Convergence Divergence (MACD) is also converging and is about to flip to a bearish crossover, further supporting the bearish view.
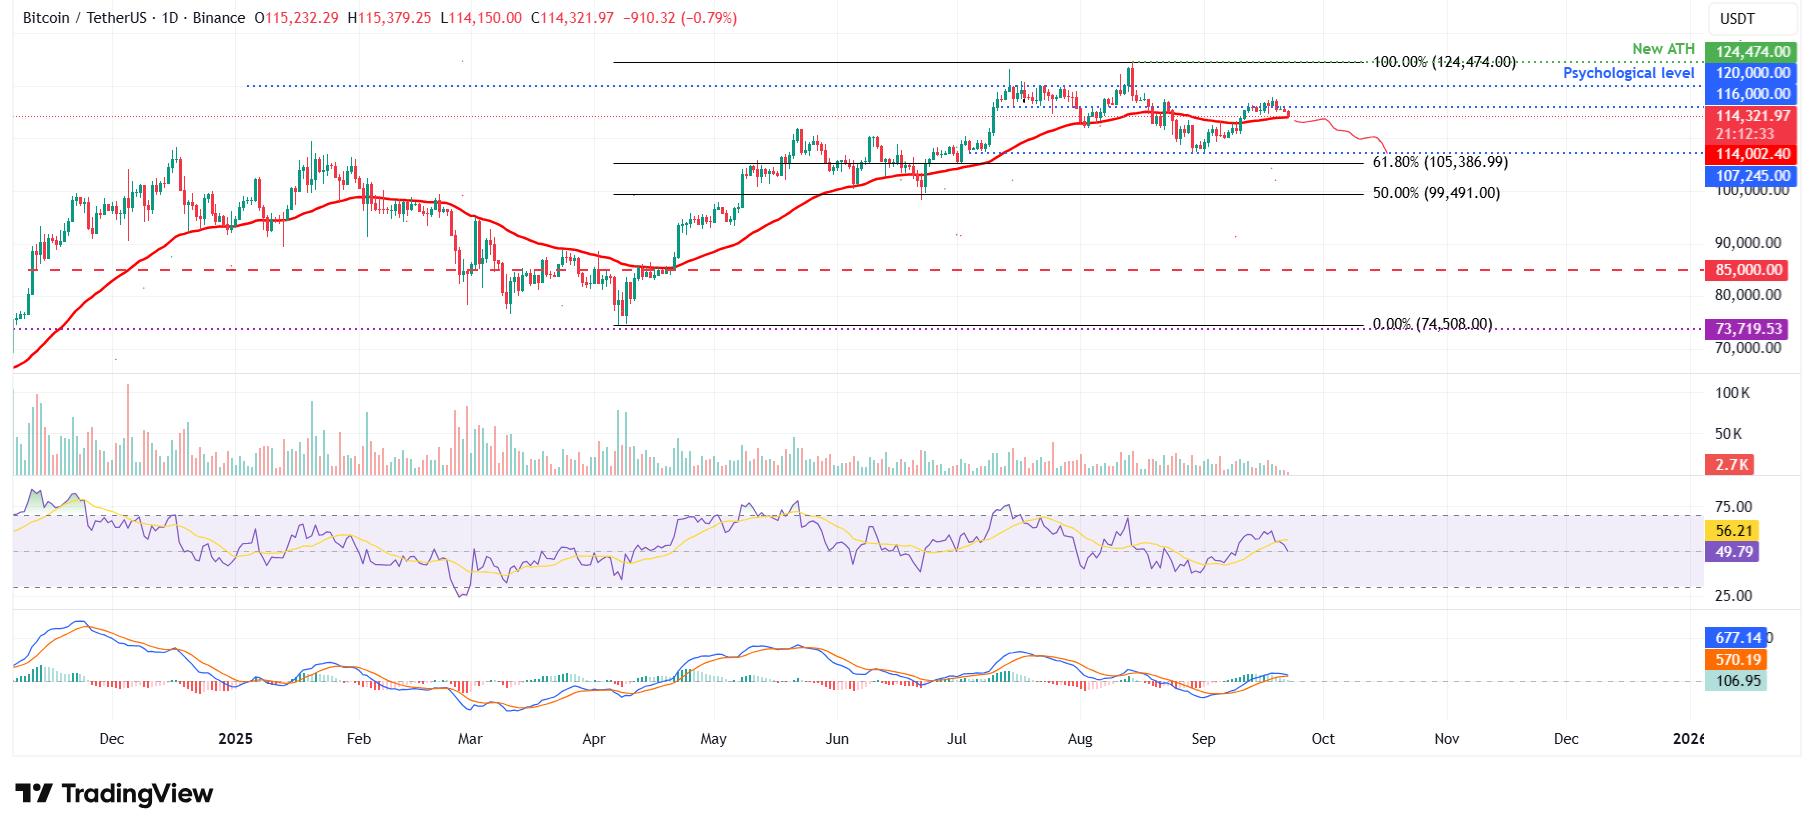
BTC/USDT daily chart
However, if BTC finds support around the 50-day EMA at $114,002, it could extend the recovery toward its daily resistance at $116,000.
Ethereum indicators lean bearish amid weak momentum
Ethereum price closed below its daily support level at $4,488 on Friday and declined slightly by Sunday. At the time of writing on Monday, it continues its decline, down 3.43% to trade around $4,293.
If ETH continues its correction and closes below its daily support at $4,232, it could extend the decline toward its next support at $3,593.
The RSI on the daily chart reads 43, which is below its neutral level of 50, indicating strong bearish momentum. The MACD also showed a bearish crossover on Friday, giving sell signals and indicating a bearish momentum ahead.
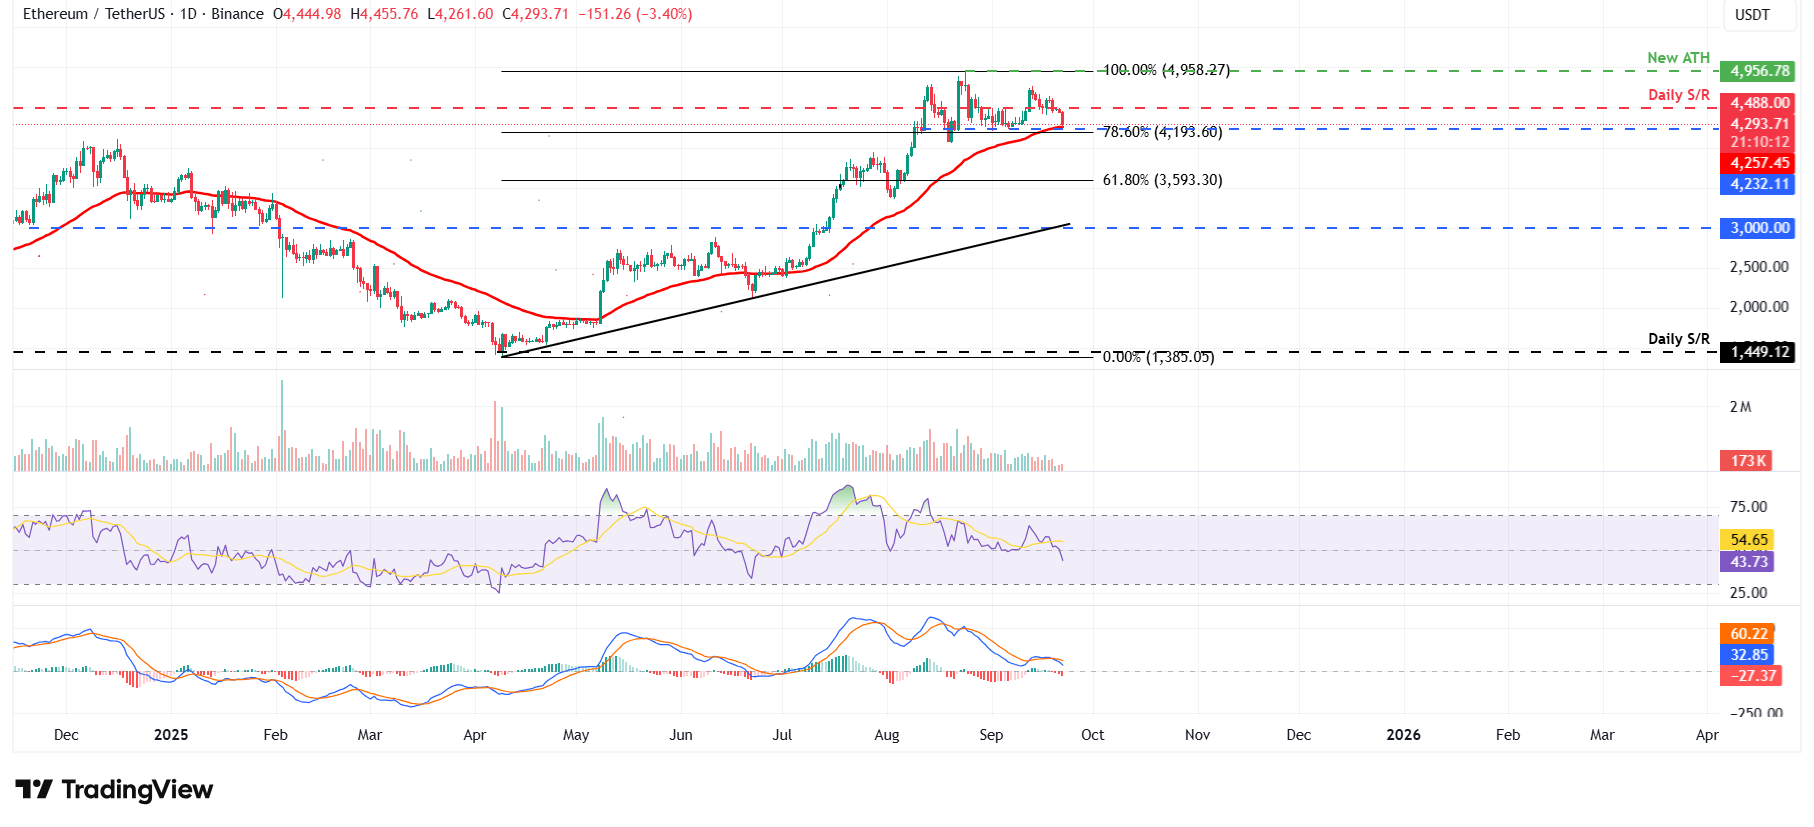
ETH/USDT daily chart
On the other hand, if ETH finds support around the daily level at $4,232 and recovers, it could extend the rally toward its daily resistance at $4,488.
XRP corrects as it closes below its 50-day EMA
Ripple's XRP price failed to maintain its upward momentum and declined by nearly 2% in the previous week. At the start of this week, on Monday, it continued its pullback, closing below the 50-day EMA and trading around $2.90.
If XRP continues its correction, it could extend the decline toward its next daily support at $2.72.
Like Ethereum, XRP’s RSI and MACD also support a bearish view.
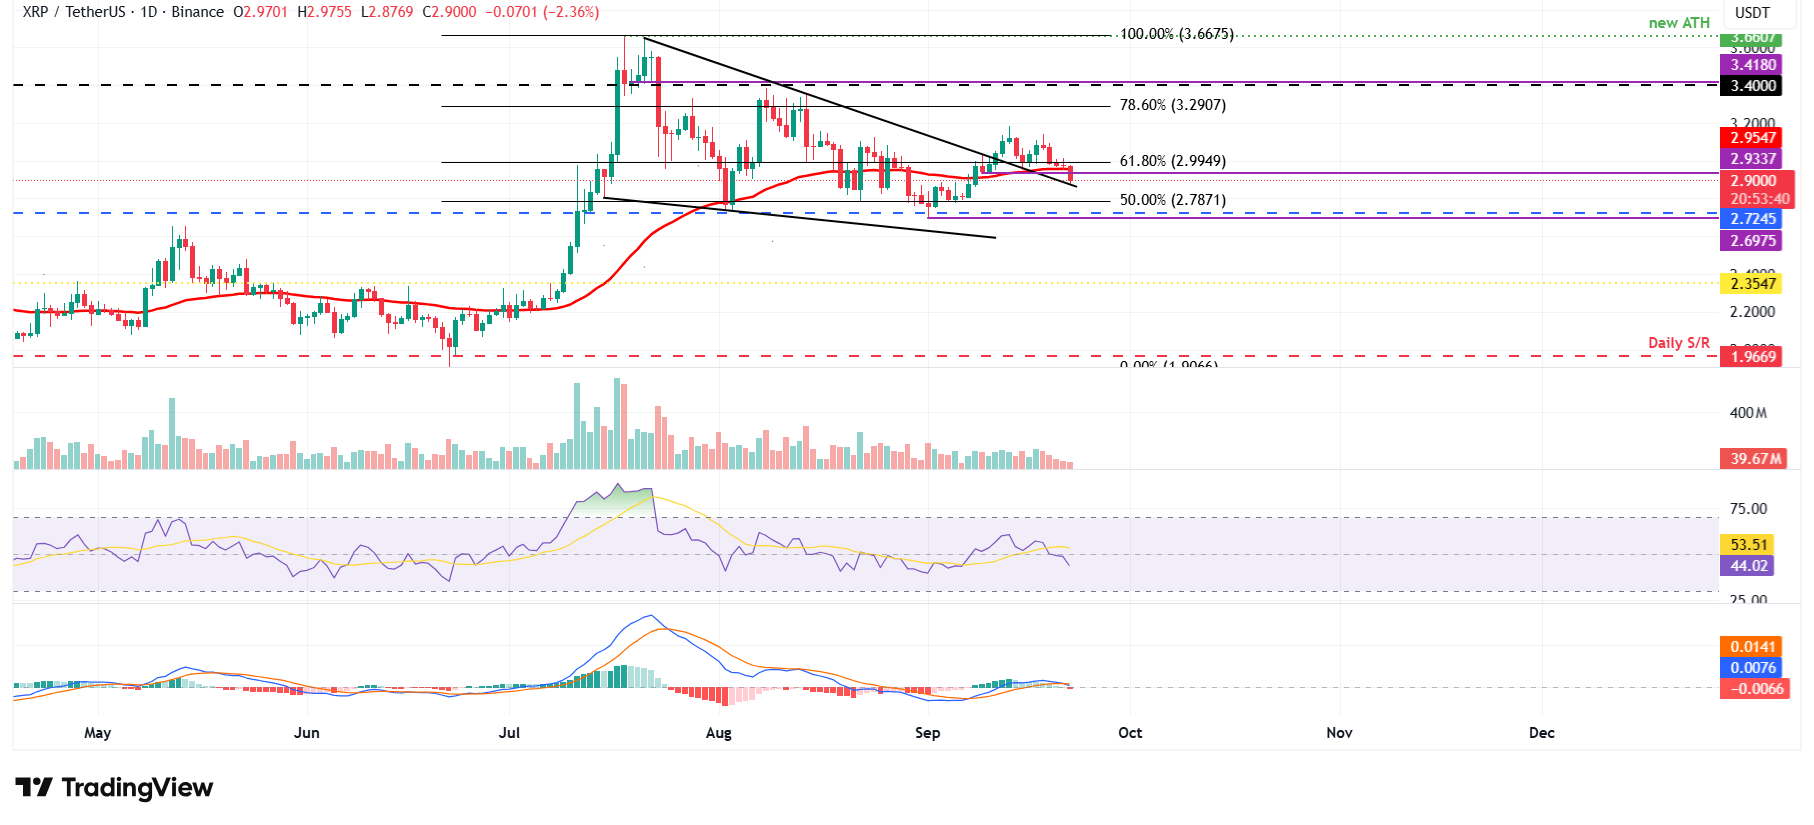
XRP/USDT daily chart
However, if XRP recovers, it could extend the recovery toward its daily resistance at $3.40.
Cryptocurrency metrics FAQs
The developer or creator of each cryptocurrency decides on the total number of tokens that can be minted or issued. Only a certain number of these assets can be minted by mining, staking or other mechanisms. This is defined by the algorithm of the underlying blockchain technology. On the other hand, circulating supply can also be decreased via actions such as burning tokens, or mistakenly sending assets to addresses of other incompatible blockchains.
Market capitalization is the result of multiplying the circulating supply of a certain asset by the asset’s current market value.
Trading volume refers to the total number of tokens for a specific asset that has been transacted or exchanged between buyers and sellers within set trading hours, for example, 24 hours. It is used to gauge market sentiment, this metric combines all volumes on centralized exchanges and decentralized exchanges. Increasing trading volume often denotes the demand for a certain asset as more people are buying and selling the cryptocurrency.
Funding rates are a concept designed to encourage traders to take positions and ensure perpetual contract prices match spot markets. It defines a mechanism by exchanges to ensure that future prices and index prices periodic payments regularly converge. When the funding rate is positive, the price of the perpetual contract is higher than the mark price. This means traders who are bullish and have opened long positions pay traders who are in short positions. On the other hand, a negative funding rate means perpetual prices are below the mark price, and hence traders with short positions pay traders who have opened long positions.
Author

Manish Chhetri
FXStreet
Manish Chhetri is a crypto specialist with over four years of experience in the cryptocurrency industry.


