Top 3 Price Prediction: Bitcoin, Ethereum, Ripple – BTC, ETH, XRP consolidate as traders await Trump’s decision
- Bitcoin finds support at the 50-day EMA around $103,100; a decisive close below this level could signal a sharp downside move.
- Ethereum approaches key support at $2,461; breaching this level would indicate a correction ahead.
- Ripple’s XRP fails to break above the 50-day EMA at $2.24, facing increased selling pressure and downside risk.

Bitcoin (BTC) price is hovering above the key support level on Friday; a breach below this level could trigger a sharp decline. Ethereum (ETH) and Ripple (XRP) followed BTC’s footsteps and stabilized around their crucial levels, with a failure below their support levels indicating a potential correction ahead.
Traders remain cautious as President Donald Trump is expected to decide within two weeks whether the US will intervene in the ongoing Israel-Iran conflict, a move that could decide the risk sentiment toward crypto markets.
Bitcoin could decline if it closes below its 50-day EMA
Bitcoin price drew liquidity from its Fair Value Gap (FVG) around $108,064 on Monday and declined by 2.1% the following day. BTC has retested and found support multiple times around the 50-day Exponential Moving Average (EMA) at approximately $103,100, highlighting its strength as dynamic support. At the time of writing on Friday, it trades at around $104,500.
If BTC continues its correction and closes below the 50-day EMA at $103,100 on a daily basis, it could extend the decline to retest its key psychologically important level at $100,000.
The Relative Strength Index (RSI) momentum indicator on the daily chart reads 47, below its neutral level of 50, indicating that bearish momentum is gaining traction. The Moving Average Convergence Divergence (MACD) indicator displayed a bearish crossover last week. It also shows rising red histogram bars below its neutral level, indicating bearish momentum and giving credence to the downward trend.
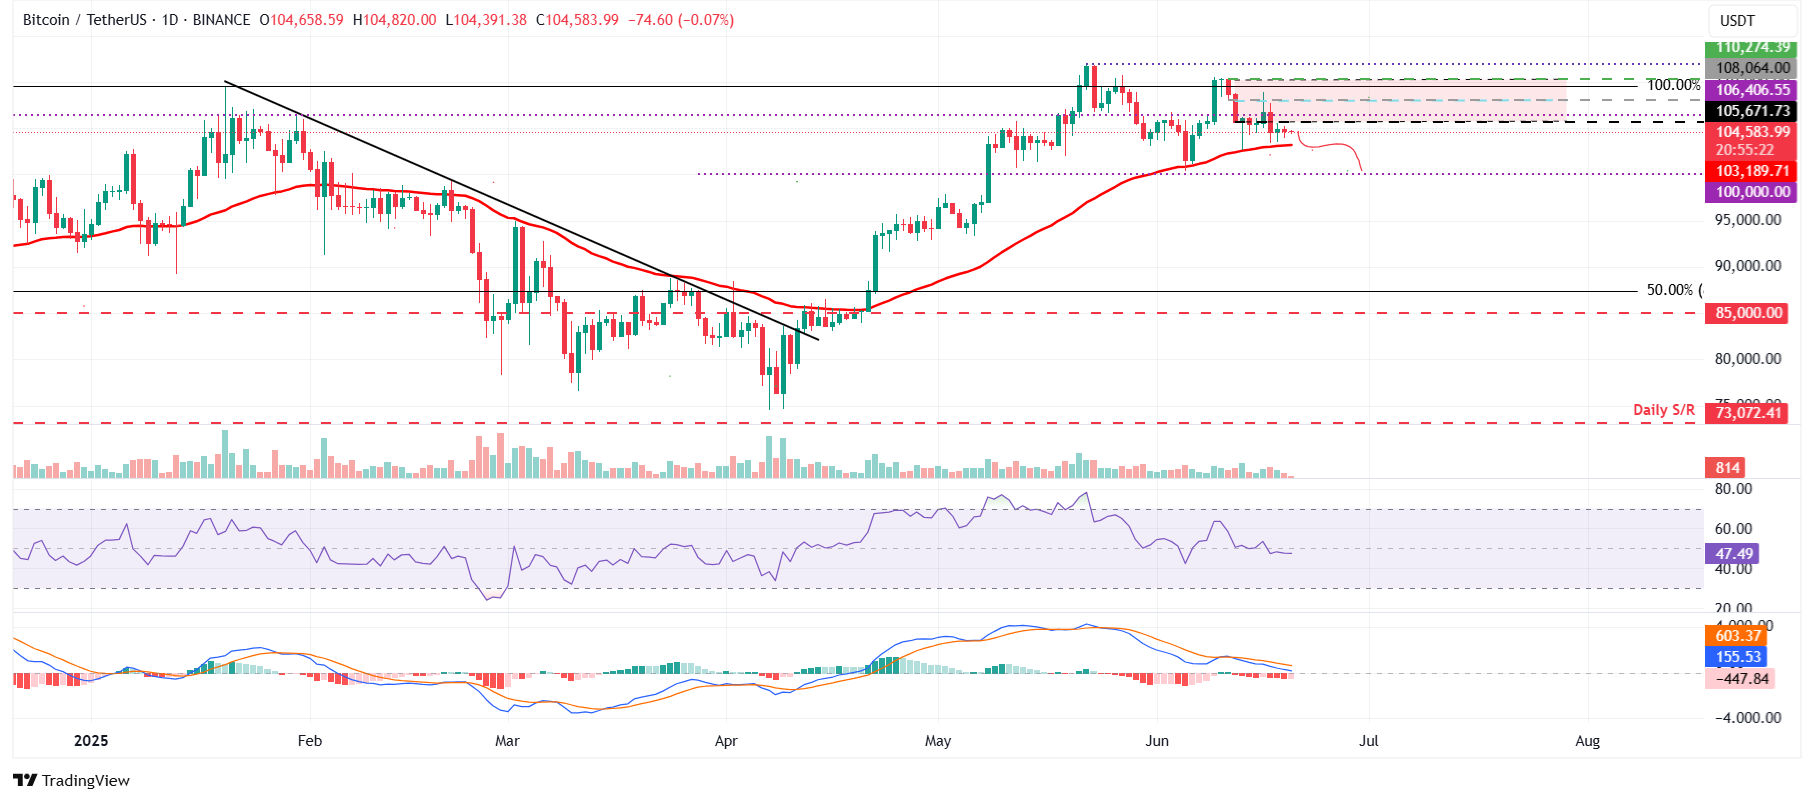
BTC/USDT daily chart
However, if BTC closes above its FVG level at $108,064, it could extend the recovery toward retesting its May 22 all-time high of $111,980.
Ethereum shows weakness in momentum indicators
Ethereum price retested and found support around its 50-day EMA at $2,441 on Wednesday, consolidating at this level the following day. This level coincides with the lower consolidation boundary of $2,461, making it a key support zone. At the time of writing on Friday, it hovers at around $2,514.
If ETH closes below the 50-day EMA at $2,441, it could extend the decline to retest its next support level at $2,000.
The RSI on the daily chart momentum indicator reads 48, below its neutral level of 50, indicating that bearish momentum is gaining traction. The MACD indicator displayed a bearish crossover last week. It also shows rising red histogram bars below its neutral level, indicating bearish momentum and giving credence to the downward trend.
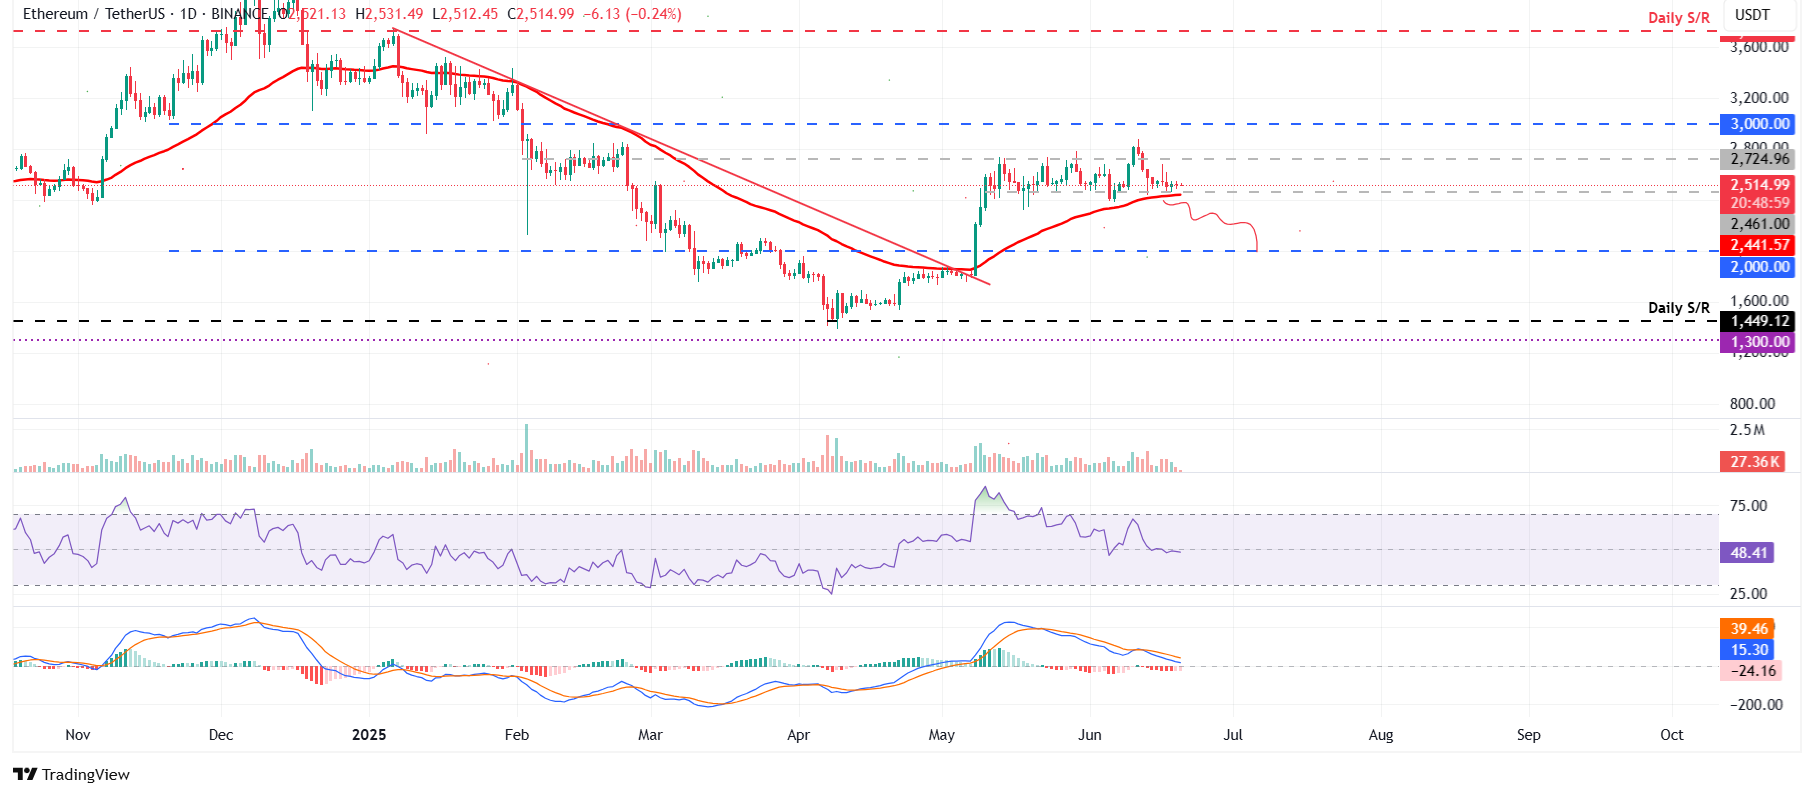
ETH/USDT daily chart
On the contrary, if ETH finds support around its 50-day EMA at $2,441 and recovers, it could extend the recovery to retest its upper consolidation boundary at $2,724.
XRP could face a downleg if the 50-EMA holds as resistance
XRP price attempted to close above the 50-day EMA at $2.24 on Monday but failed, subsequently declining by 3.53% the following day and consolidating around the $2.15 level until Thursday. At the time of writing on Friday, it hovers around $2.16.
If XRP faces a correction, it could extend the decline to retest its next daily support level at $1.96.
The RSI on the daily chart reads 44, below its neutral level and points downward, indicating strong bearish momentum. Moreover, the MACD indicator on the daily chart displayed a bearish crossover, signaling a sell and indicating a downward trend.
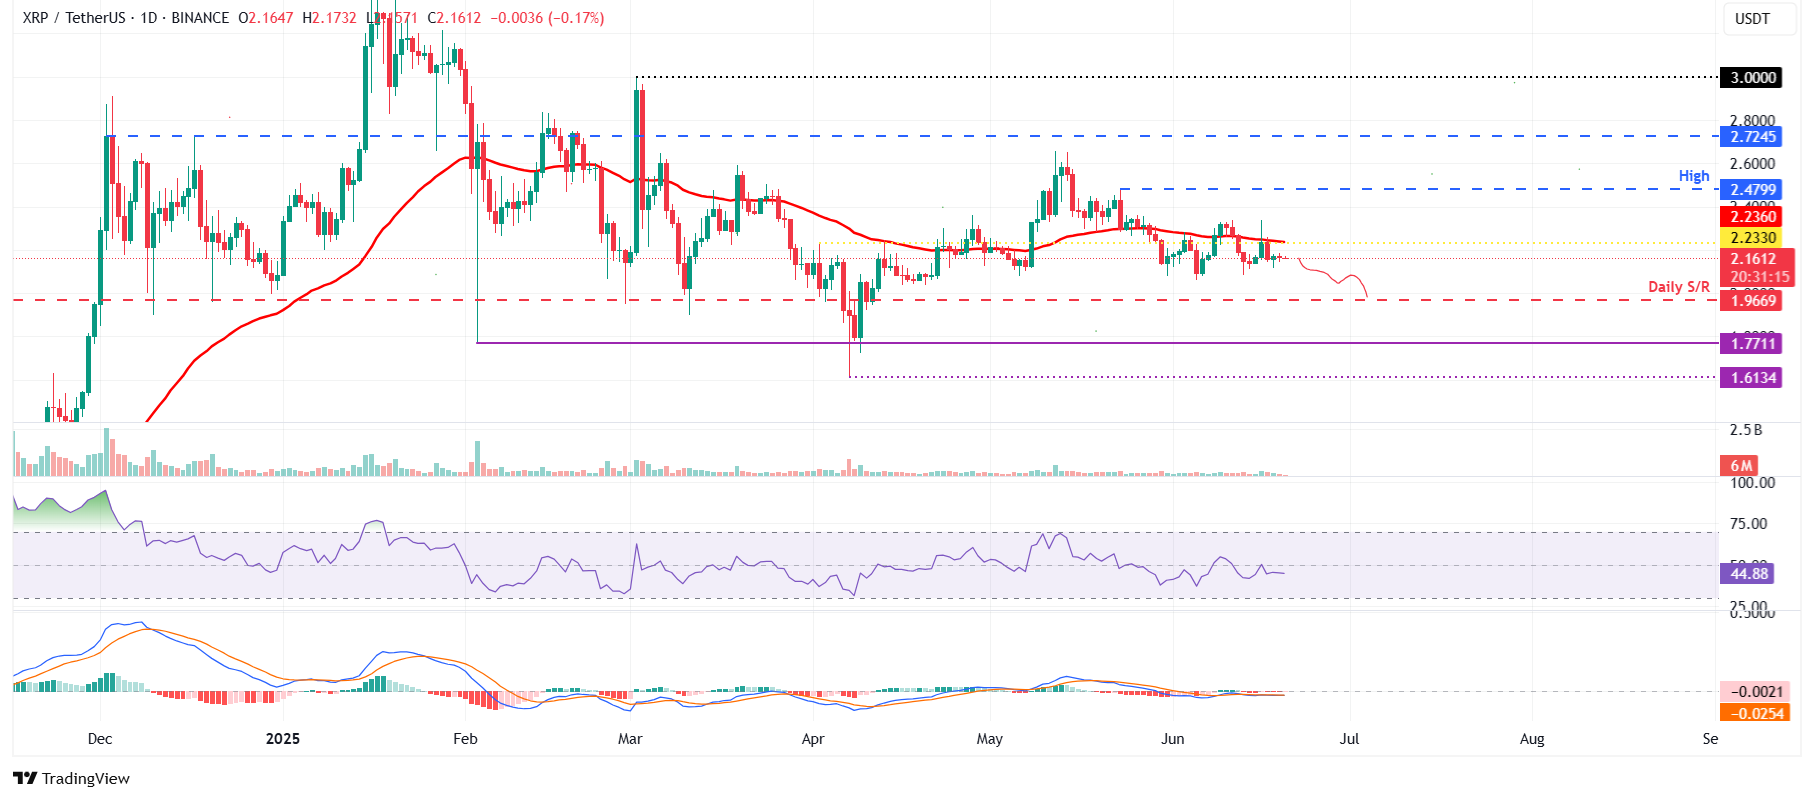
XRP/USDT daily chart
However, if XRP recovers and closes above the 50-day EMA at $2.24, it could extend the recovery toward the May 23 high of $2.47.
Bitcoin, altcoins, stablecoins FAQs
Bitcoin is the largest cryptocurrency by market capitalization, a virtual currency designed to serve as money. This form of payment cannot be controlled by any one person, group, or entity, which eliminates the need for third-party participation during financial transactions.
Altcoins are any cryptocurrency apart from Bitcoin, but some also regard Ethereum as a non-altcoin because it is from these two cryptocurrencies that forking happens. If this is true, then Litecoin is the first altcoin, forked from the Bitcoin protocol and, therefore, an “improved” version of it.
Stablecoins are cryptocurrencies designed to have a stable price, with their value backed by a reserve of the asset it represents. To achieve this, the value of any one stablecoin is pegged to a commodity or financial instrument, such as the US Dollar (USD), with its supply regulated by an algorithm or demand. The main goal of stablecoins is to provide an on/off-ramp for investors willing to trade and invest in cryptocurrencies. Stablecoins also allow investors to store value since cryptocurrencies, in general, are subject to volatility.
Bitcoin dominance is the ratio of Bitcoin's market capitalization to the total market capitalization of all cryptocurrencies combined. It provides a clear picture of Bitcoin’s interest among investors. A high BTC dominance typically happens before and during a bull run, in which investors resort to investing in relatively stable and high market capitalization cryptocurrency like Bitcoin. A drop in BTC dominance usually means that investors are moving their capital and/or profits to altcoins in a quest for higher returns, which usually triggers an explosion of altcoin rallies.
Author

Manish Chhetri
FXStreet
Manish Chhetri is a crypto specialist with over four years of experience in the cryptocurrency industry.



