TOP 3 price prediction Bitcoin, Ethereum, Ripple: At crossroads under the burning Sun - Mid-Term Forecast
-
Bitcoin touches $7,855 support, technical scenario wide open.
-
Ethereum is still in a high-danger area, with no room for surprises.
-
Ripple has reached its limit support, awaiting a bullish trigger.

European session has awaken to the news of a BTC/USD quick slide towards the support level around $7,855. As quick as it dropped, it has gone back to its opening price, leaving behind the $8,000 level with a couple of candlestick closures in the very-short term. Is this actually news? This is Bitcoin we’re talking about!
Tomorrow I’m heading to the beach for some holidays for a couple weeks, so here I’m posting an analysis based on the daily-range charts, with projection for the upcoming trading sessions.
BTC/USD 1 D
The BTC/USD is currently trading at $8,111, trying to beat the congestion resistance at $8.175. That would open up an attempt to attack the trend line that has been holding back Bitcoin from July 25th. This is not going to be an easy task, as the SMA200 on the daily chart is just trading above it. This moving average should be the real test, as its proximity makes the current technical situation the one to watch out for.
Below the current price, BTC/USD is likely to fall even to the level of the EMA50 at $7,310, needing to break through the price congestion levels of $8,000, $7,855 and $7,740. Below this exponential average, BTC/USD would lose traction and could quickly fall to $6,500, where the reliability of the support should indicate the possible future scenario.
Above the current price, the primary challenge is in the already mentioned SMA200, and if BTC/USD manages to get above this moving average, it will lead an upward movement, with rises that may be significant. First resistance is at the price congestion level at $8,800, followed by $9,150, $9,650 and $9,820. Above this last price level, we find a trend line that acts as a channel ceiling in the $10,150 price zone.
To me, the most likely scenario for BTC/USD in the coming days would be the following one:
Lateral movement following the trend line that goes through the $8,250 level, waiting for the averages to reduce the distance between them. Then, the EMA50 might overcome the SMA100 at first, and then the SMA200. This scenario would imply freedom of movement for BTC/USD throughout the area of influence of the three moving averages. Each attempt to cross above the exponential average will lead to an increase in volatility, so we could see an increase in the daily range of BTC/USD.
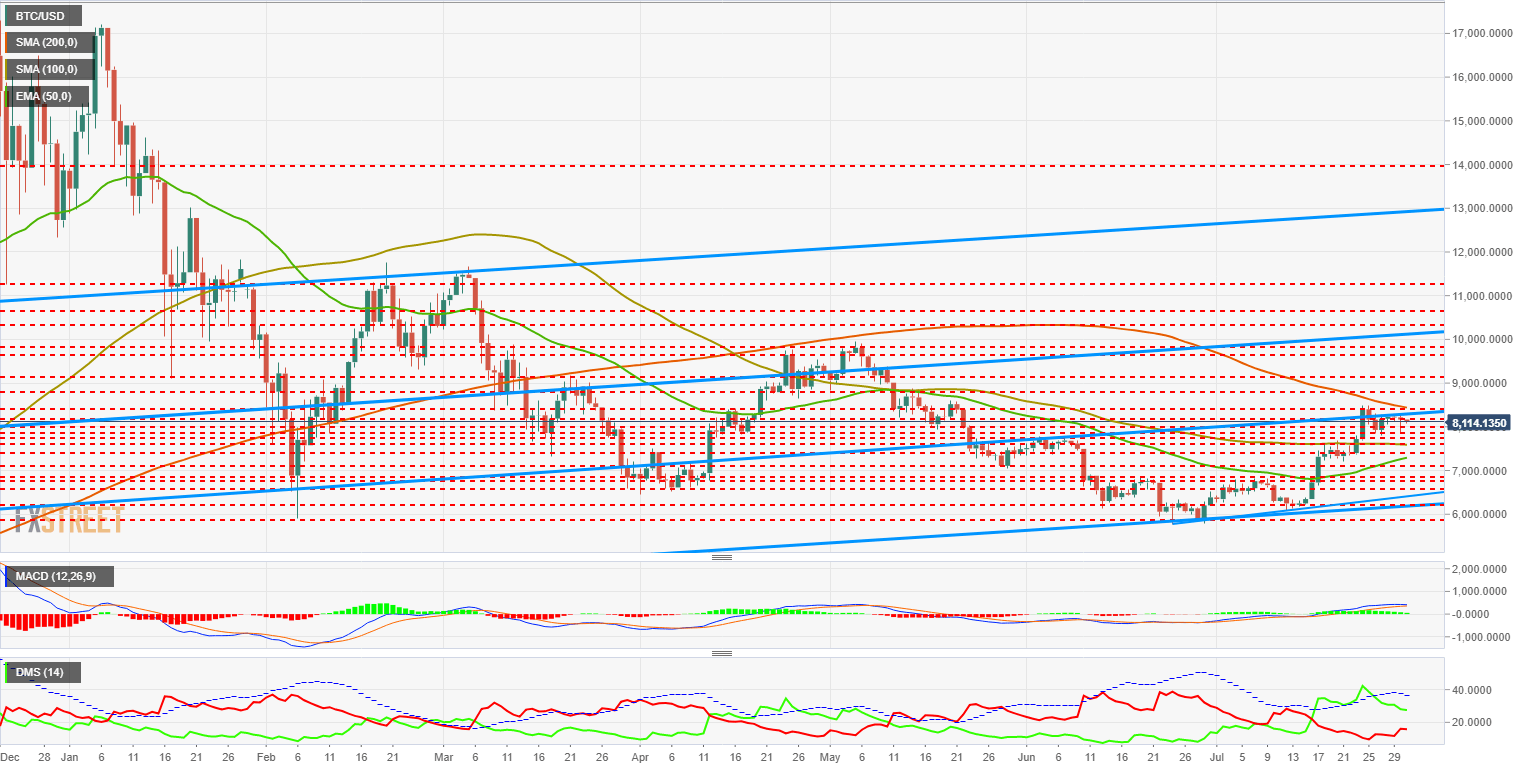
The MACD in the daily chart displays a downward cut-off profile of the signal line that is likely to cause an upward bounce on its first attempt. If BTC/USD manages to break the trend line or even the SMA200 on that bounce, we could see an upward extension. If neither level is consolidated, BTC/USD might move to the EMA50 area.
The Directional Movement Index shows that buyers are decreasing their activity, while sellers are increasing their positions but not reaching important levels. The ADX continues to decline but continues to indicate a healthy trend level.
Get 24/7 Crypto updates in our social media channels: Give us a follow at @FXSCrypto and our FXStreet Crypto Trading Telegram channel
ETH/USD 1D
Above the current price, ETH/USD has a significant amount of resistance levels. Above this, the next resistance level is at $483, where we find price congestion and the level at which the EMA50 is now passing. If ETH/USD manages to breach this exponential average, the next target is price congestion resistance at $520.
Below the current price, there is very little room for speculation. First support on the trend line that draws the channel's base at the $435 price level. Any close below this last price would require a reassessment of the situation and our position in the market.
In the scenario I see as the most likely, ETH/USD takes the lead for an upward movement looking for the $520 level. If ETH/USD can break above this level, it will enter the next segment of the bullish channel with a ceiling at the $580 level. This intermediate segment is the scenario that seems favorable to me, where the moving averages converge and end up crossing to the upside.
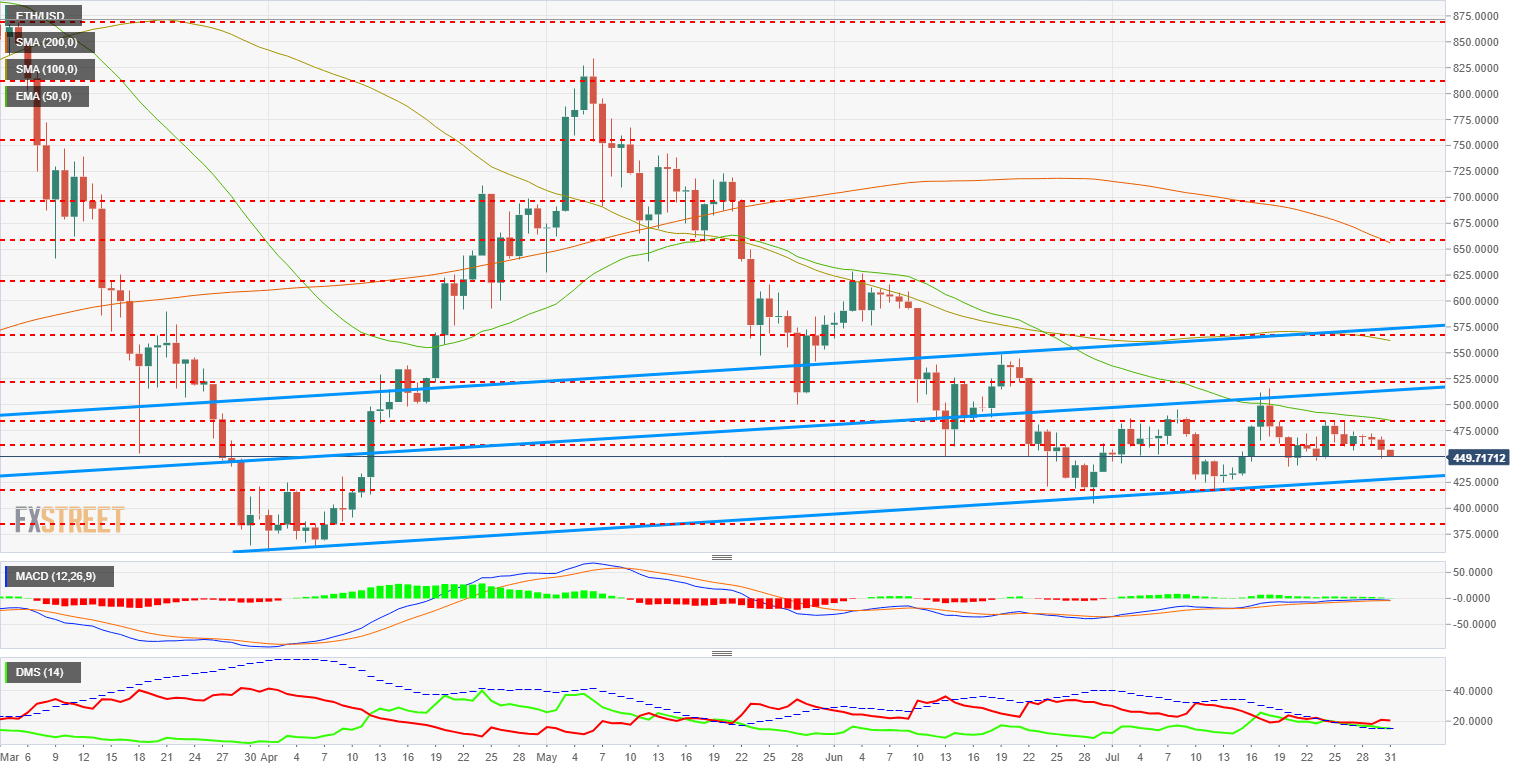
The MACD has a very horizontal structure, attached to the 0 line on the underside. If a bullish cross occurs, it will be with increased volatility, so it is possible that it moves down quickly, to open the indicator and allow for a bullish cross.
The Directional Movement Index does not show sellers outperforming buyers, although it has not reached significant levels. Likely continuous position swings over the next few days. The ADX indicates no trend in progress.
XRP/USD 1D
The situation of XRP/USD does not resemble the one of its peers in this analysis. It is currently trading at $0.437, breaking the downward trend line that has been guiding it since the April lows. XRP/USD should not close below this price today, or else the chances of moving towards the $0.25 level would increase considerably. Ripple raises some doubts about whether it is a coin, due to the centralized structure of its network and its function of providing liquidity to the parent company. At some point, the market has to evaluate this situation and force the managers of RIPPLE LTD to offer a solution that value the assets.
While below the current price there is little margin and the limits are very clear, on the upside, there is still a long way to go. First resistance it is located at $0.50. This price level is essential to avoid a painful fall to new lows for the year. Before that critical level, Ripple will have to conquer the EMA50 that runs through the $0,494 level. Above $0.50, resistance in price levels of $0.549.
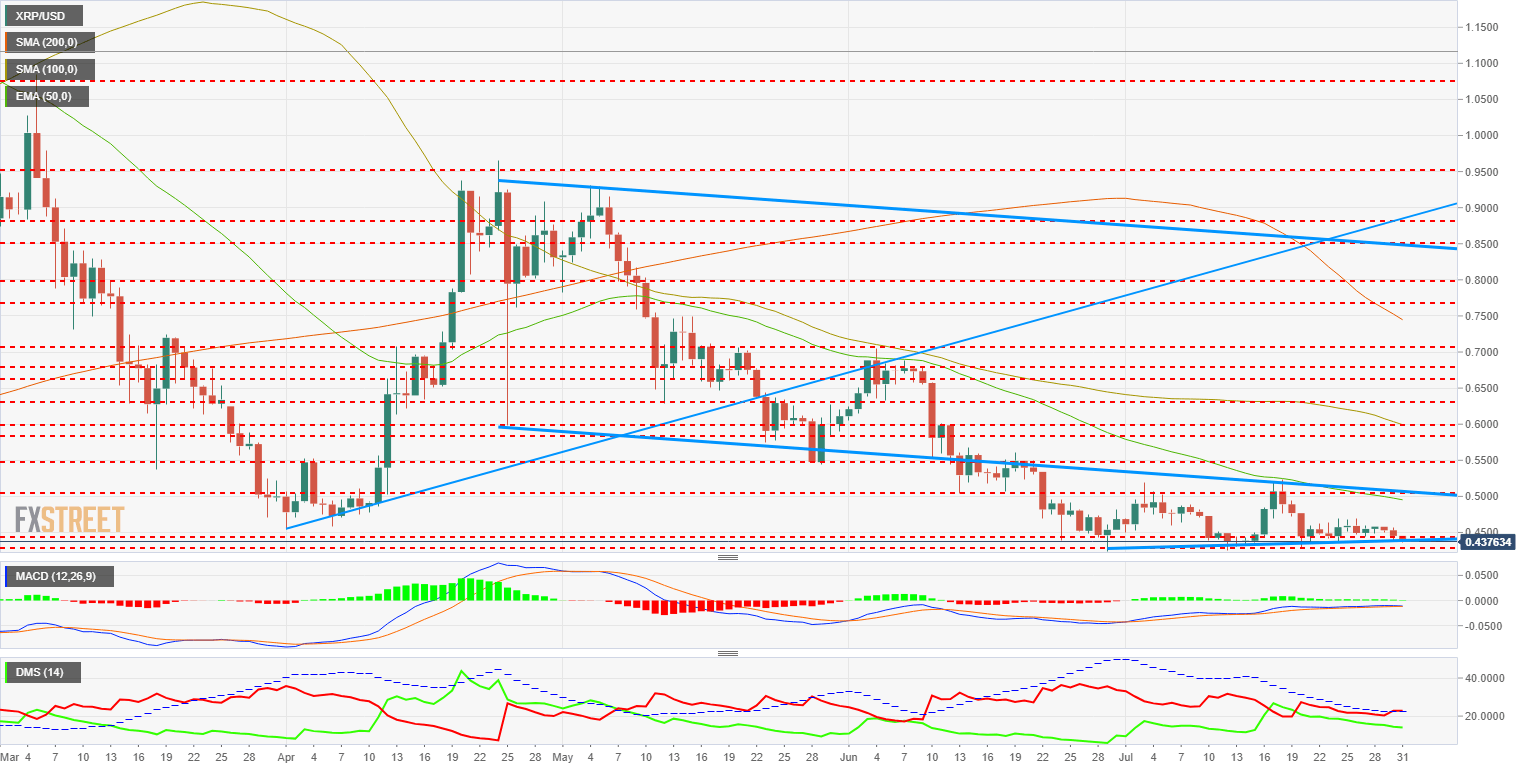
The MACD daily shows a profile similar to the one shown by Ethereum and is one of the few things in the whole analysis that provides some optimism in the future price development, with the chance of avoiding new annual lows.
The Directional Movement Index is not so confident and shows the buyers in constant decline while sellers are encouraged, having breached the line of ADX and the 20 level of the indicator. This brings consistency to the selling trend.
Author

Tomas Salles
FXStreet
Tomàs Sallés was born in Barcelona in 1972, he is a certified technical analyst after having completing specialized courses in Spain and Switzerland. He expanded his technical training following the guidance of great experts on the financial markets.


